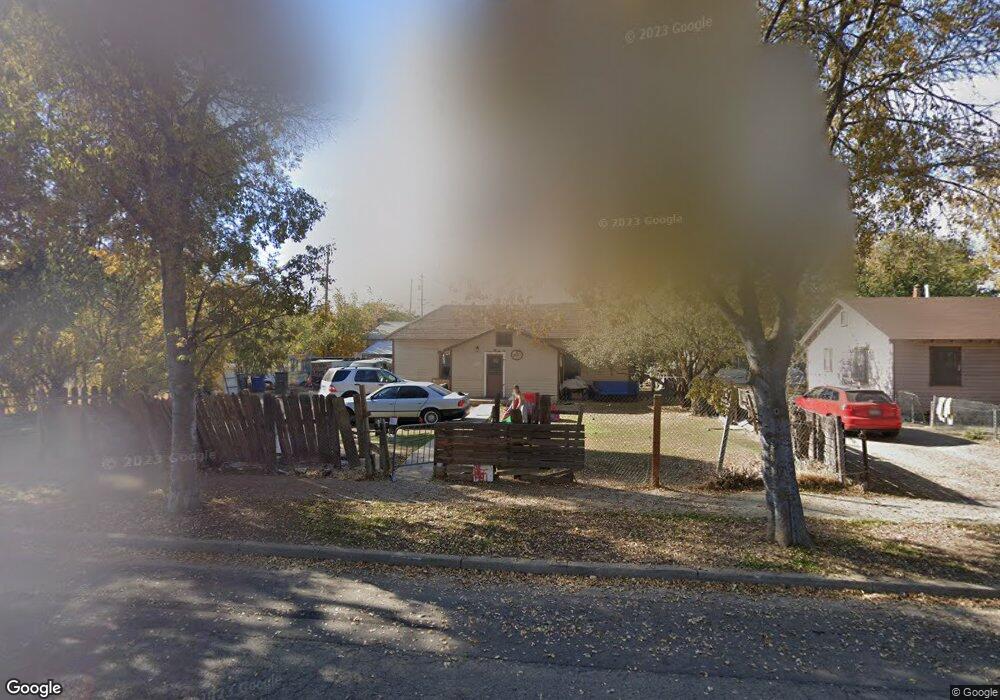
429 S 3rd St Patterson, CA 95363
Patterson AreaEstimated Value: $336,000
About This Home
This home is located at 429 S 3rd St, Patterson, CA 95363 and is currently estimated at $336,000, approximately $151 per square foot. 429 S 3rd St is a home located in Stanislaus County with nearby schools including Las Palmas Elementary School, Creekside Middle School, and Patterson High School.
Ownership History
We collect this data history from publicly available records. To have your information removed, we recommend requesting removal directly through your county’s website.
Purchase Details
Home Financials for this Owner
Home Financials are based on the most recent Mortgage that was taken out on this home.Purchase Details
Home Values in the Area
Average Home Value in this Area
Purchase History
We collect this data history from publicly available records. To have your information removed, we recommend requesting removal directly through your county’s website.
| Date | Buyer | Sale Price | Title Company |
|---|---|---|---|
| -- | Chicago Title Co | ||
| -- | -- |
Mortgage History
We collect this data history from publicly available records. To have your information removed, we recommend requesting removal directly through your county’s website.
| Date | Status | Borrower | Loan Amount |
|---|---|---|---|
| Open | $250,000 |
Tax History
We collect this data history from publicly available records. To have your information removed, we recommend requesting removal directly through your county’s website.
| Year | Tax Paid | Tax Assessment Tax Assessment Total Assessment is a certain percentage of the fair market value that is determined by local assessors to be the total taxable value of land and additions on the property. | Land | Improvement |
|---|---|---|---|---|
| 2025 | $997 | $81,964 | $34,028 | $47,936 |
| 2024 | $994 | $80,358 | $33,361 | $46,997 |
| 2023 | $973 | $78,783 | $32,707 | $46,076 |
| 2022 | $920 | $77,239 | $32,066 | $45,173 |
| 2021 | $907 | $75,726 | $31,438 | $44,288 |
| 2020 | $908 | $74,950 | $31,116 | $43,834 |
| 2019 | $895 | $73,481 | $30,506 | $42,975 |
| 2018 | $853 | $72,041 | $29,908 | $42,133 |
| 2017 | $836 | $70,629 | $29,322 | $41,307 |
| 2016 | $815 | $69,246 | $28,748 | $40,498 |
| 2015 | $801 | $68,207 | $28,317 | $39,890 |
| 2014 | $783 | $66,872 | $27,763 | $39,109 |
Map
- 0 Locust Ave
- 250 E Las Palmas Ave Unit 37
- 250 E Las Palmas Ave Unit 35
- 10037 California 33
- 230 N 3rd St
- 205 Weber Ave
- 505 Tuscany Ct
- 217 Tyler St
- 832 Orkney Dr
- 0 K St
- 514 N 2nd St
- 408 Peregrine Dr
- 1117 Van Gogh Ln
- 534 Lola Ln
- 1430 Walnut Ave
- 403 Elfers Rd
- 425 Elfers Rd
- 1212 Shearwater Dr
- 16012 Sycamore Ave
- 712 Walnut Ave
Ask me questions while you tour the home.