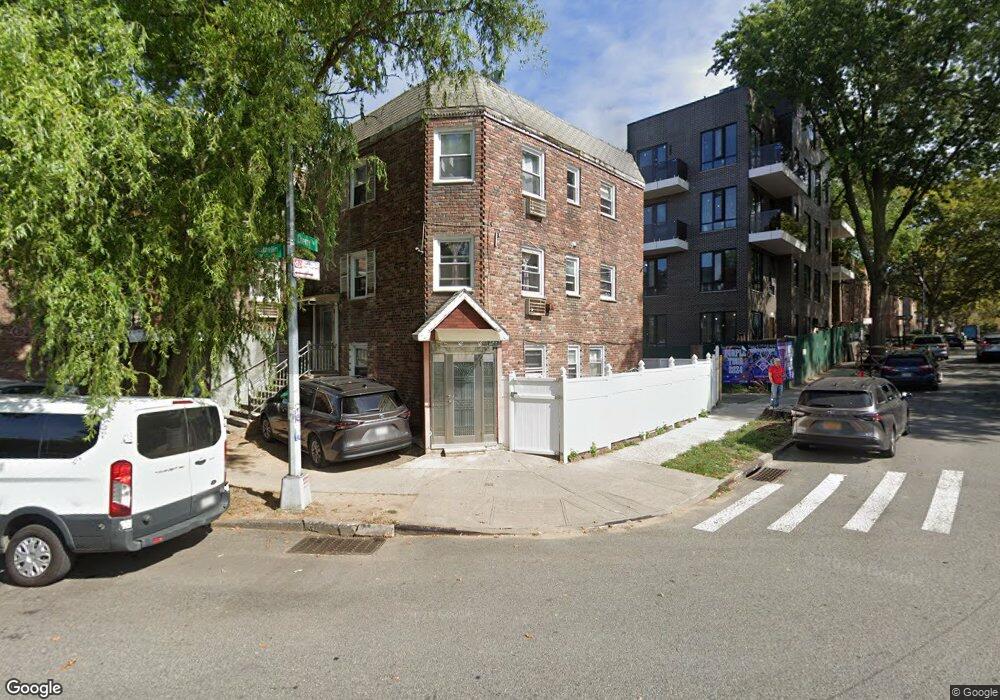
4297 Crommelin Ave Flushing, NY 11355
Flushing NeighborhoodEstimated Value: $1,573,646 - $2,511,000
--
Bed
--
Bath
3,420
Sq Ft
$602/Sq Ft
Est. Value
About This Home
This home is located at 4297 Crommelin Ave, Flushing, NY 11355 and is currently estimated at $2,060,162, approximately $602 per square foot. 4297 Crommelin Ave is a home located in Queens County with nearby schools including P.S. 120 - Queens, Rachel Carson I.S. 237Q, and John Bowne High School.
Ownership History
Date
Name
Owned For
Owner Type
Purchase Details
Closed on
May 10, 2021
Sold by
Deng Zihao and Guo Rong
Bought by
Deng Zihao and Guo Rong
Current Estimated Value
Purchase Details
Closed on
Jun 19, 2017
Sold by
Shen Xiu Ru
Bought by
Deng Zihao and Guo Rong
Home Financials for this Owner
Home Financials are based on the most recent Mortgage that was taken out on this home.
Original Mortgage
$900,000
Outstanding Balance
$746,966
Interest Rate
3.94%
Mortgage Type
Commercial
Estimated Equity
$1,313,196
Purchase Details
Closed on
Apr 9, 2013
Sold by
Shen Qian and Shen Xiu Ru
Bought by
Shen Xiu Ru
Purchase Details
Closed on
Nov 9, 2010
Sold by
Shen Qian and Zhang Yulin
Bought by
Shen Qian and Shen Xiu Ru
Purchase Details
Closed on
Jan 8, 2008
Sold by
42-97 Crommelin Realty Corp
Bought by
Shen Qian and Zhang Yulin
Purchase Details
Closed on
Mar 1, 2000
Sold by
Zhang Yu Lin and Shen Xiu Ru
Bought by
42 & 97 Crommelin Realty Corp
Create a Home Valuation Report for This Property
The Home Valuation Report is an in-depth analysis detailing your home's value as well as a comparison with similar homes in the area
Home Values in the Area
Average Home Value in this Area
Purchase History
| Date | Buyer | Sale Price | Title Company |
|---|---|---|---|
| Deng Zihao | -- | -- | |
| Deng Zihao | $1,550,000 | -- | |
| Shen Xiu Ru | -- | -- | |
| Shen Qian | -- | -- | |
| Shen Qian | -- | -- | |
| 42 & 97 Crommelin Realty Corp | -- | Stewart Title |
Source: Public Records
Mortgage History
| Date | Status | Borrower | Loan Amount |
|---|---|---|---|
| Open | Deng Zihao | $900,000 |
Source: Public Records
Tax History Compared to Growth
Tax History
| Year | Tax Paid | Tax Assessment Tax Assessment Total Assessment is a certain percentage of the fair market value that is determined by local assessors to be the total taxable value of land and additions on the property. | Land | Improvement |
|---|---|---|---|---|
| 2025 | $11,495 | $60,664 | $9,163 | $51,501 |
| 2024 | $11,495 | $57,230 | $9,313 | $47,917 |
| 2023 | $11,495 | $57,230 | $8,222 | $49,008 |
| 2022 | $11,339 | $121,800 | $18,180 | $103,620 |
| 2021 | $11,277 | $107,160 | $18,180 | $88,980 |
| 2020 | $10,701 | $97,980 | $18,180 | $79,800 |
| 2019 | $9,977 | $103,320 | $18,180 | $85,140 |
| 2018 | $9,722 | $47,692 | $9,094 | $38,598 |
| 2017 | $9,649 | $47,334 | $9,619 | $37,715 |
| 2016 | $8,927 | $47,334 | $9,619 | $37,715 |
| 2015 | $5,386 | $42,128 | $12,180 | $29,948 |
| 2014 | $5,386 | $39,744 | $13,794 | $25,950 |
Source: Public Records
Map
Nearby Homes
- 42-95 Crommelin St
- 42-98 Saull St Unit 402
- 42-98 Saull St Unit 401
- 43-15 Saull St Unit 15-3D
- 13338 Avery Ave Unit 2RA
- 134-39 Blossom Ave Unit 1H
- 13218 Avery Ave Unit 3
- 132-25 Avery Ave
- 134-34 Franklin Ave Unit 4G
- 4318 Main St Unit 12A
- 132-36 Pople Ave Unit 3
- 132-47 Pople Ave
- 132-39 Pople Ave Unit 3
- 42-42 Colden St Unit C1
- 42-42 Colden St Unit 622
- 44-15 College Point Blvd Unit 3F
- 44-15 College Point Blvd Unit 6D
- 44-15 College Point Blvd Unit 6B
- 44-15 College Point Blvd Unit 5B
- 44-15 College Point Blvd Unit 3B
- 42-97 Crommelin Ave
- 4295 Crommelin Ave
- 43-07 Crommelin Ave
- 43-07 Crommelin Ave Unit 2nd Fl
- 42-93 Crommelin St
- 42-93 Crommelin St Unit 3Fl
- 4293 Crommelin Ave
- 4291 Crommelin Ave
- 4298 Saull St
- 4296 Saull St
- 42-93 Crommelin Ave
- 4294 Saull St
- 4289 Crommelin Ave
- 4292 Saull St
- 4290 Saull St
- 4287 Crommelin Ave
- 42-90 Saull St
- 42-98 Saull St Unit 2Fl
- 42-98 Saull St Unit 301
- 42-98 Saull St