43 Happy Trail Santa Fe, NM 87505
Old Las Vegas Corridor NeighborhoodEstimated Value: $1,207,000 - $1,684,000
4
Beds
1
Bath
217,800
Sq Ft
$7/Sq Ft
Est. Value
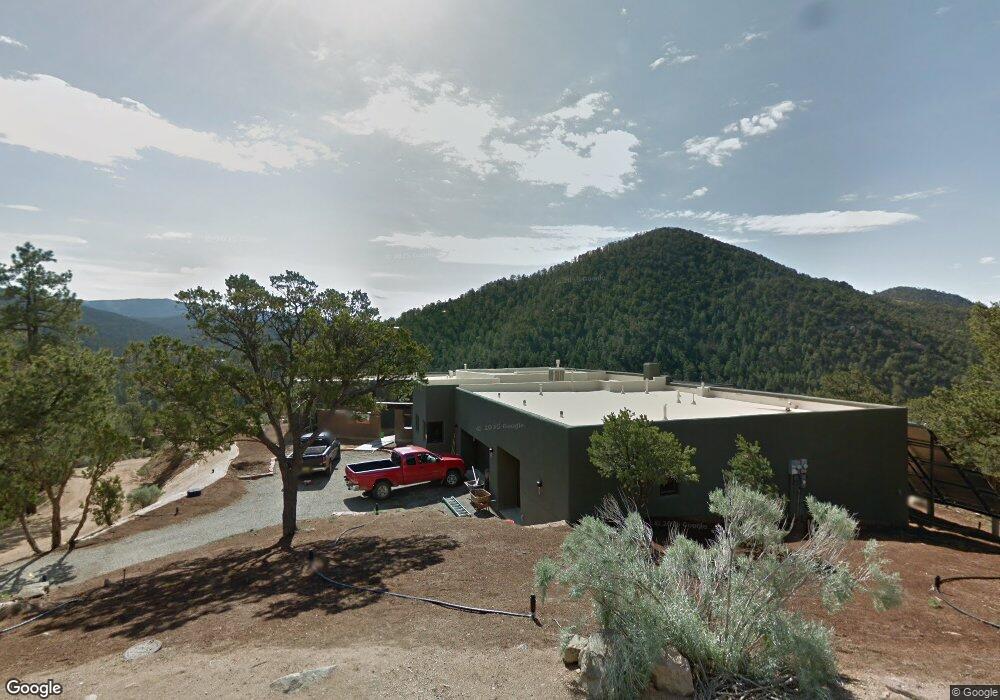
About This Home
This home is located at 43 Happy Trail, Santa Fe, NM 87505 and is currently estimated at $1,430,925, approximately $6 per square foot. 43 Happy Trail is a home located in Santa Fe County with nearby schools including Atalaya Elementary School, Santa Fe High School, and Desert Academy.
Ownership History
Date
Name
Owned For
Owner Type
Purchase Details
Closed on
May 6, 2024
Sold by
Render Gerald C and Suimners Susan B
Bought by
Summers-Render Trust and Summers
Current Estimated Value
Purchase Details
Closed on
Apr 12, 2013
Sold by
Carlisle Sarah Komalam and Carlisle Wyndham
Bought by
Render Gerald C and Summers Susan B
Home Financials for this Owner
Home Financials are based on the most recent Mortgage that was taken out on this home.
Original Mortgage
$800,000
Interest Rate
3.45%
Mortgage Type
Construction
Purchase Details
Closed on
Apr 13, 2012
Sold by
Carlisle Sarah Lomalam and Carlisle Wyndham
Bought by
Render Gerald C and Summers Susan B
Purchase Details
Closed on
Sep 6, 2007
Sold by
Neilson R Todd
Bought by
Mahaim Pierre
Purchase Details
Closed on
Nov 29, 2006
Sold by
Janu Jean M and Janu Jean
Bought by
Neilson R Todd and Estate Of Reed E Slatkin
Create a Home Valuation Report for This Property
The Home Valuation Report is an in-depth analysis detailing your home's value as well as a comparison with similar homes in the area
Home Values in the Area
Average Home Value in this Area
Purchase History
| Date | Buyer | Sale Price | Title Company |
|---|---|---|---|
| Summers-Render Trust | -- | None Listed On Document | |
| Render Gerald C | -- | First American Title Insuran | |
| Render Gerald C | -- | Southwestern Title & Escrow | |
| Mahaim Pierre | -- | St&E | |
| Neilson R Todd | -- | None Available |
Source: Public Records
Mortgage History
| Date | Status | Borrower | Loan Amount |
|---|---|---|---|
| Previous Owner | Render Gerald C | $800,000 |
Source: Public Records
Tax History Compared to Growth
Tax History
| Year | Tax Paid | Tax Assessment Tax Assessment Total Assessment is a certain percentage of the fair market value that is determined by local assessors to be the total taxable value of land and additions on the property. | Land | Improvement |
|---|---|---|---|---|
| 2024 | -- | $861,153 | $187,948 | $673,205 |
| 2023 | $0 | $836,072 | $182,474 | $653,598 |
| 2022 | $0 | $811,722 | $177,160 | $634,562 |
| 2021 | $0 | $262,693 | $57,333 | $205,360 |
| 2020 | $5,392 | $255,084 | $53,999 | $201,085 |
| 2019 | $5,392 | $247,654 | $53,999 | $193,655 |
| 2018 | $5,248 | $240,441 | $53,999 | $186,442 |
| 2017 | $5,148 | $237,185 | $53,999 | $183,186 |
| 2016 | $4,829 | $230,277 | $100,000 | $130,277 |
| 2015 | $5,678 | $261,103 | $100,000 | $161,103 |
| 2014 | $1,131 | $53,280 | $53,280 | $0 |
Source: Public Records
Map
Nearby Homes
- 109 Coyote Mountain Rd
- 103 Coyote Mountain Rd
- 6 Overlook Rd
- 29 La Barbaria Rd
- 20 Grey Fox Ln
- 136 Overlook Rd
- 196 Overlook Rd
- 197 Overlook Rd
- 2 Toltec Rd
- 15 Toltec Rd
- 205 Double Arrow Rd Unit A
- 98 La Barbaria Trail
- 193 Double Arrow Rd
- 17 Sueno de Santa Fe
- 215 Double Arrow Rd
- 41 Ridge Rd
- 7 La Vista
- 2 Ute Ln
- 117 La Ventana
- 16 S Cloudstone Dr
- 44 Happy Trail
- 7 the Red Rd
- 15 the Red Rd
- 47 Happy Trail
- 14 the Red Rd
- 88 Happy Trail
- 67 Happy Trail
- 72 Happy Trail
- 97B La Barbaria Rd
- 97 B La Barbaria
- 89 La Barbaria Rd
- 72 Camino Cielo Alto
- 74 Happy Trail
- 97 La Barberia Rd Unit A
- 97 La Barbaria Rd
- 97 La Barbaria Rd Unit A
- 73 La Barbaria Rd Unit B & C
- 81B La Barbaria Rd
- 81 La Barbaria Rd Unit C
- 105 La Barberia Rd