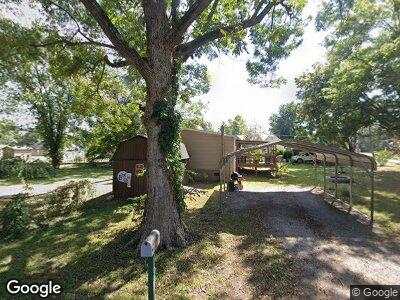
43 Walnut St Trimble, TN 38259
Estimated Value: $36,558 - $72,000
--
Bed
--
Bath
848
Sq Ft
$61/Sq Ft
Est. Value
About This Home
This home is located at 43 Walnut St, Trimble, TN 38259 and is currently estimated at $51,890, approximately $61 per square foot. 43 Walnut St is a home with nearby schools including Trimble Elementary School, Northview Middle School, and Dyer County High School.
Ownership History
Date
Name
Owned For
Owner Type
Purchase Details
Closed on
Dec 7, 2022
Sold by
Harrison Alan B
Bought by
Chandler Ryan and Carter Codi Lynn
Current Estimated Value
Home Financials for this Owner
Home Financials are based on the most recent Mortgage that was taken out on this home.
Original Mortgage
$25,941
Outstanding Balance
$23,635
Interest Rate
6.36%
Mortgage Type
New Conventional
Estimated Equity
$19,253
Purchase Details
Closed on
Aug 5, 2022
Sold by
Williams Family Farms And Properties Llc
Bought by
Harrison Alan B
Purchase Details
Closed on
Jan 11, 2022
Sold by
Dyer Circut Court
Bought by
Harrison Jeff and Lynn Vir Jimmy
Purchase Details
Closed on
Jan 5, 2012
Sold by
Holland Randy Shawn
Bought by
Harrison Jeff
Purchase Details
Closed on
Oct 23, 1996
Sold by
Coleman Charles W
Bought by
Holland Randy
Purchase Details
Closed on
Oct 4, 1988
Bought by
Coleman Charles W and Coleman Connie
Purchase Details
Closed on
May 4, 1987
Bought by
Hinson Jack L and Pope Betty A
Purchase Details
Closed on
Jul 15, 1944
Bought by
Hinson Evdley P
Create a Home Valuation Report for This Property
The Home Valuation Report is an in-depth analysis detailing your home's value as well as a comparison with similar homes in the area
Home Values in the Area
Average Home Value in this Area
Purchase History
| Date | Buyer | Sale Price | Title Company |
|---|---|---|---|
| Chandler Ryan | $32,000 | Dyer Land Title | |
| Harrison Alan B | -- | Dyer Land Title | |
| Harrison Jeff | $6,600 | Johnston Mark D | |
| Harrison Jeff | $2,450 | -- | |
| Holland Randy | $17,000 | -- | |
| Coleman Charles W | $12,000 | -- | |
| Hinson Jack L | -- | -- | |
| Hinson Evdley P | -- | -- |
Source: Public Records
Mortgage History
| Date | Status | Borrower | Loan Amount |
|---|---|---|---|
| Open | Chandler Ryan | $25,941 | |
| Previous Owner | Holland Carrie E | $37,983 |
Source: Public Records
Tax History Compared to Growth
Tax History
| Year | Tax Paid | Tax Assessment Tax Assessment Total Assessment is a certain percentage of the fair market value that is determined by local assessors to be the total taxable value of land and additions on the property. | Land | Improvement |
|---|---|---|---|---|
| 2024 | $177 | $7,175 | $750 | $6,425 |
| 2023 | $300 | $7,175 | $750 | $6,425 |
| 2022 | $293 | $7,175 | $750 | $6,425 |
| 2021 | $293 | $7,175 | $750 | $6,425 |
| 2020 | $170 | $7,175 | $750 | $6,425 |
| 2019 | $285 | $6,525 | $475 | $6,050 |
| 2018 | $275 | $6,525 | $475 | $6,050 |
| 2017 | $275 | $6,525 | $475 | $6,050 |
| 2016 | $275 | $6,525 | $475 | $6,050 |
| 2015 | $265 | $6,525 | $475 | $6,050 |
| 2014 | $265 | $6,525 | $475 | $6,050 |
Source: Public Records
Map
Nearby Homes
- 220 7th St
- 00 Obion Ave
- 419 W Main Ave
- 1426 W Palestine Ave
- 802 Joy Dr
- 3576 Frog Level Rd
- 51 Warren St
- 6095 Tatumville Rd
- 1585 Sharps Ferry Rd
- 185 Loys Johnson Rd
- 0 Biffle Rd
- 4671 Hurt Rd
- 56 Zarecor Rd
- 218 Washington St
- 507 Radford St
- 307 Parks St
- 54 Zarecor Rd
- 322 Jones St
- 577 Baker Loop Rd
- 142 Kay Rd