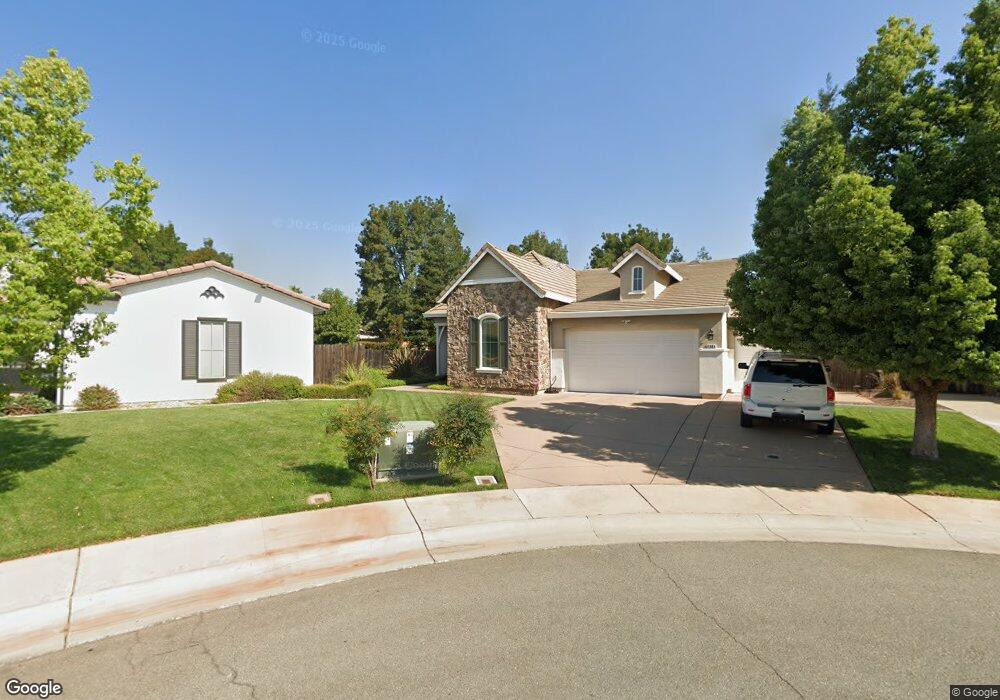
4304 Kestrel Ct Redding, CA 96002
South Bechelli NeighborhoodEstimated Value: $536,000 - $572,000
4
Beds
2
Baths
2,301
Sq Ft
$241/Sq Ft
Est. Value
About This Home
This home is located at 4304 Kestrel Ct, Redding, CA 96002 and is currently estimated at $554,327, approximately $240 per square foot. 4304 Kestrel Ct is a home located in Shasta County with nearby schools including Lassen View Elementary School, Parsons Junior High School, and Enterprise High School.
Ownership History
Date
Name
Owned For
Owner Type
Purchase Details
Closed on
Sep 17, 2020
Sold by
Olsen Stetson
Bought by
Olsen Stetson R and Olsen Jennifer N
Current Estimated Value
Purchase Details
Closed on
May 22, 2020
Sold by
Olsen Stetson
Bought by
Olsen Stetson
Home Financials for this Owner
Home Financials are based on the most recent Mortgage that was taken out on this home.
Original Mortgage
$283,000
Outstanding Balance
$197,952
Interest Rate
3.3%
Mortgage Type
New Conventional
Estimated Equity
$356,375
Purchase Details
Closed on
Jun 28, 2007
Sold by
D R Horton Inc Sacramento
Bought by
Olsen Stetson
Home Financials for this Owner
Home Financials are based on the most recent Mortgage that was taken out on this home.
Original Mortgage
$343,067
Interest Rate
6.21%
Mortgage Type
Purchase Money Mortgage
Create a Home Valuation Report for This Property
The Home Valuation Report is an in-depth analysis detailing your home's value as well as a comparison with similar homes in the area
Home Values in the Area
Average Home Value in this Area
Purchase History
| Date | Buyer | Sale Price | Title Company |
|---|---|---|---|
| Olsen Stetson R | -- | None Available | |
| Olsen Stetson | -- | Fidelity Natl Ttl Co Of Ca | |
| Olsen Stetson | $381,500 | Fidelity Natl Title Co Of Ca |
Source: Public Records
Mortgage History
| Date | Status | Borrower | Loan Amount |
|---|---|---|---|
| Open | Olsen Stetson | $283,000 | |
| Closed | Olsen Stetson | $343,067 |
Source: Public Records
Tax History
| Year | Tax Paid | Tax Assessment Tax Assessment Total Assessment is a certain percentage of the fair market value that is determined by local assessors to be the total taxable value of land and additions on the property. | Land | Improvement |
|---|---|---|---|---|
| 2025 | $6,218 | $549,848 | $133,968 | $415,880 |
| 2024 | $6,123 | $539,068 | $131,342 | $407,726 |
| 2023 | $6,123 | $528,499 | $128,767 | $399,732 |
| 2022 | $5,947 | $518,138 | $126,243 | $391,895 |
| 2021 | $5,343 | $470,000 | $75,000 | $395,000 |
| 2020 | $4,833 | $425,000 | $75,000 | $350,000 |
| 2019 | $4,631 | $410,000 | $80,000 | $330,000 |
| 2018 | $4,402 | $390,000 | $85,000 | $305,000 |
| 2017 | $4,750 | $390,000 | $85,000 | $305,000 |
| 2016 | $4,273 | $367,000 | $80,000 | $287,000 |
| 2015 | $4,162 | $365,000 | $80,000 | $285,000 |
| 2014 | $4,169 | $360,000 | $80,000 | $280,000 |
Source: Public Records
Map
Nearby Homes
- 723 Woodacre Dr
- 4323 Churn Crk Rd
- 3708 Traverse St
- 4302 Paulson Ln
- 688 Julie Way
- 5367 Rosswood Ln
- 3703 Harrow Ct
- 3527 Adams Ln
- 3500 Pioneer Ln
- 1513 Harpole Rd
- 1209 C St
- 952 Camino Ct
- 1106 2nd St
- 3428 Adams Ln
- 99999 Churn Creek Rd
- 3232 Nicolet Ln
- 2940 Felstet Ln
- 1108 4th St
- 1091 Del Sol Place
- 4624 Columbine Dr
- 4301 Kestrel Ct
- 4354 Kestrel Ct
- 751 Woodacre Dr
- 765 Woodacre Dr
- 737 Woodacre Dr
- 4347 Kestrel Ct
- 4394 Kestrel Ct
- 779 Woodacre Dr
- 682 Rivercrest Pkwy
- 4322 Chinook Dr
- 4340 Chinook Dr
- 793 Woodacre Dr
- 4358 Chinook Dr
- 709 Woodacre Dr
- 752 Rivercrest Pkwy
- 770 Woodacre Dr
- 672 Rivercrest Pkwy
- 4376 Chinook Dr
- 780 Woodacre Dr
- 4261 Jane St
Your Personal Tour Guide
Ask me questions while you tour the home.