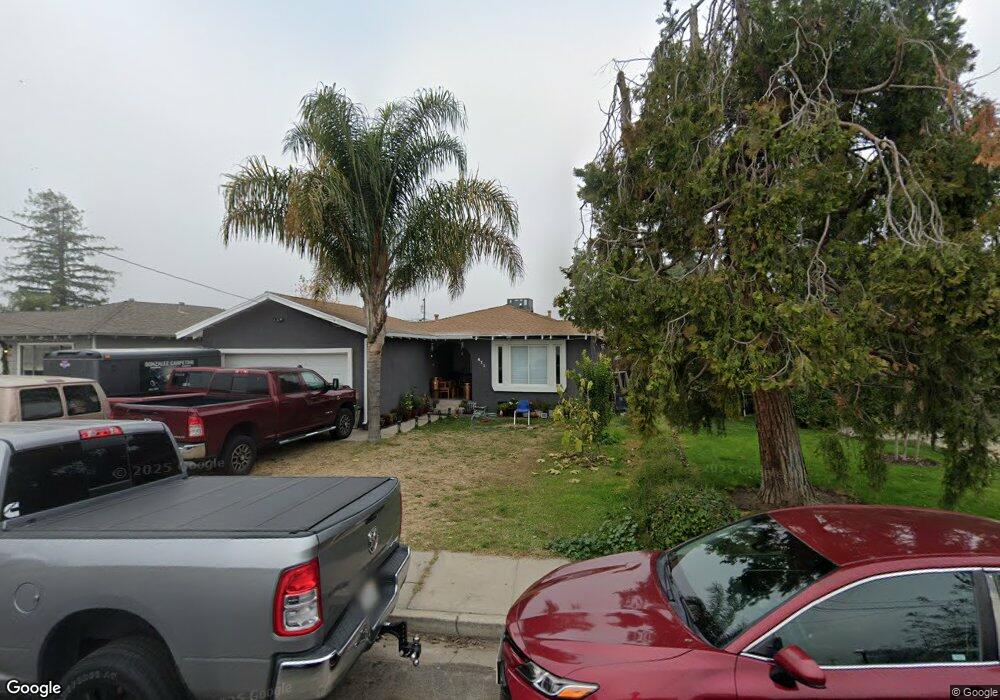
431 Bothun Rd Turlock, CA 95380
Estimated Value: $352,000 - $446,000
5
Beds
3
Baths
1,489
Sq Ft
$279/Sq Ft
Est. Value
About This Home
This home is located at 431 Bothun Rd, Turlock, CA 95380 and is currently estimated at $414,794, approximately $278 per square foot. 431 Bothun Rd is a home located in Stanislaus County with nearby schools including Julien Elementary School, Marvin A. Dutcher Middle School, and Turlock Junior High School.
Ownership History
Date
Name
Owned For
Owner Type
Purchase Details
Closed on
Sep 23, 2003
Sold by
Gonzalez Mario
Bought by
Gonzalez Mario and Gonzalez Teresa
Current Estimated Value
Home Financials for this Owner
Home Financials are based on the most recent Mortgage that was taken out on this home.
Original Mortgage
$100,000
Outstanding Balance
$46,167
Interest Rate
6.17%
Mortgage Type
Purchase Money Mortgage
Estimated Equity
$368,627
Purchase Details
Closed on
Jan 9, 2001
Sold by
Gonzales Teresa
Bought by
Gonzales Mario
Home Financials for this Owner
Home Financials are based on the most recent Mortgage that was taken out on this home.
Original Mortgage
$75,700
Interest Rate
7.41%
Purchase Details
Closed on
Dec 10, 2000
Sold by
Linda M Brenda James K and Martelli Robert L
Bought by
Gonzales Mario
Home Financials for this Owner
Home Financials are based on the most recent Mortgage that was taken out on this home.
Original Mortgage
$75,700
Interest Rate
7.41%
Create a Home Valuation Report for This Property
The Home Valuation Report is an in-depth analysis detailing your home's value as well as a comparison with similar homes in the area
Purchase History
| Date | Buyer | Sale Price | Title Company |
|---|---|---|---|
| Gonzalez Mario | -- | First American Title Co | |
| Gonzales Mario | -- | Chicago Title Co | |
| Gonzales Mario | $95,000 | Chicago Title Co |
Source: Public Records
Mortgage History
| Date | Status | Borrower | Loan Amount |
|---|---|---|---|
| Open | Gonzalez Mario | $100,000 | |
| Previous Owner | Gonzales Mario | $75,700 |
Source: Public Records
Tax History
| Year | Tax Paid | Tax Assessment Tax Assessment Total Assessment is a certain percentage of the fair market value that is determined by local assessors to be the total taxable value of land and additions on the property. | Land | Improvement |
|---|---|---|---|---|
| 2025 | $1,822 | $176,561 | $59,080 | $117,481 |
| 2024 | $1,786 | $173,100 | $57,922 | $115,178 |
| 2023 | $1,782 | $169,707 | $56,787 | $112,920 |
| 2022 | $1,758 | $166,380 | $55,674 | $110,706 |
| 2021 | $1,731 | $163,119 | $54,583 | $108,536 |
| 2020 | $1,718 | $161,448 | $54,024 | $107,424 |
| 2019 | $1,688 | $158,283 | $52,965 | $105,318 |
| 2018 | $1,685 | $155,180 | $51,927 | $103,253 |
| 2017 | $1,644 | $152,138 | $50,909 | $101,229 |
| 2016 | $1,534 | $149,156 | $49,911 | $99,245 |
| 2015 | $1,519 | $146,917 | $49,162 | $97,755 |
| 2014 | $1,503 | $144,040 | $48,199 | $95,841 |
Source: Public Records
Map
Nearby Homes
- 1030 Alpha Rd
- 1040 S Rose St
- 1598 East Ave
- 102 I St
- 599 S Minaret Ave
- 938 Zina Ln
- 528 S Minaret Ave
- 1550 E Marshall St
- 205 G St
- 2213 Evelle Ln
- 310 W F St
- 437 Lemongrass St
- 445 Lemongrass St
- 1412 S 1st St Unit B
- 449 Lemongrass St
- 436 Lemongrass St
- 440 Lemongrass St
- 1202 Impression St
- 2005 E Marshall St
- 2521 East Ave
Your Personal Tour Guide
Ask me questions while you tour the home.