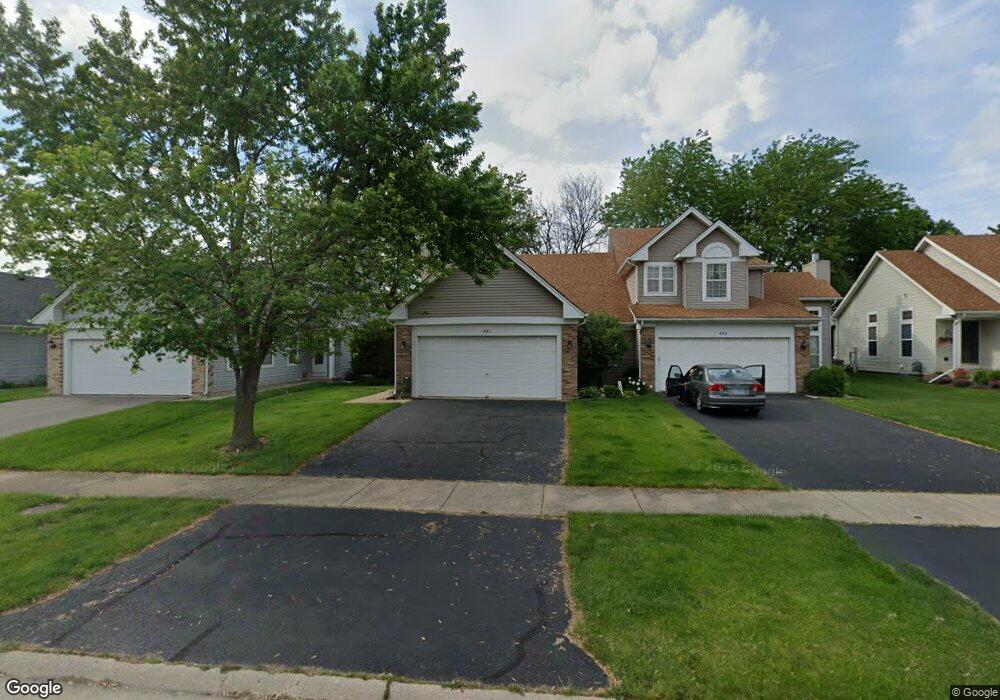
431 Prairieview Dr Oswego, IL 60543
South Oswego NeighborhoodEstimated Value: $277,000 - $297,586
2
Beds
2
Baths
1,346
Sq Ft
$216/Sq Ft
Est. Value
About This Home
This home is located at 431 Prairieview Dr, Oswego, IL 60543 and is currently estimated at $291,147, approximately $216 per square foot. 431 Prairieview Dr is a home located in Kendall County with nearby schools including Prairie Point Elementary School, Traughber Junior High School, and Oswego High School.
Ownership History
Date
Name
Owned For
Owner Type
Purchase Details
Closed on
Jun 19, 2006
Sold by
Adair Gerald and Adair Patricia
Bought by
Bradley Susan L
Current Estimated Value
Home Financials for this Owner
Home Financials are based on the most recent Mortgage that was taken out on this home.
Original Mortgage
$161,500
Interest Rate
10.47%
Mortgage Type
Purchase Money Mortgage
Purchase Details
Closed on
Nov 4, 2002
Sold by
Coglianese Barbara A
Bought by
Adair Gerald L and Adair Patricia C
Home Financials for this Owner
Home Financials are based on the most recent Mortgage that was taken out on this home.
Original Mortgage
$150,100
Interest Rate
6.01%
Create a Home Valuation Report for This Property
The Home Valuation Report is an in-depth analysis detailing your home's value as well as a comparison with similar homes in the area
Home Values in the Area
Average Home Value in this Area
Purchase History
| Date | Buyer | Sale Price | Title Company |
|---|---|---|---|
| Bradley Susan L | $190,000 | None Available | |
| Adair Gerald L | $158,000 | -- |
Source: Public Records
Mortgage History
| Date | Status | Borrower | Loan Amount |
|---|---|---|---|
| Previous Owner | Bradley Susan L | $161,500 | |
| Previous Owner | Adair Gerald L | $150,100 |
Source: Public Records
Tax History Compared to Growth
Tax History
| Year | Tax Paid | Tax Assessment Tax Assessment Total Assessment is a certain percentage of the fair market value that is determined by local assessors to be the total taxable value of land and additions on the property. | Land | Improvement |
|---|---|---|---|---|
| 2024 | $5,769 | $82,695 | $12,085 | $70,610 |
| 2023 | $4,964 | $71,909 | $10,509 | $61,400 |
| 2022 | $4,964 | $65,971 | $9,641 | $56,330 |
| 2021 | $4,906 | $63,433 | $9,270 | $54,163 |
| 2020 | $4,780 | $61,585 | $9,000 | $52,585 |
| 2019 | $4,907 | $62,116 | $9,000 | $53,116 |
| 2018 | $4,433 | $54,412 | $10,909 | $43,503 |
| 2017 | $4,526 | $50,149 | $10,054 | $40,095 |
| 2016 | $4,320 | $47,535 | $9,530 | $38,005 |
| 2015 | $4,237 | $44,845 | $8,991 | $35,854 |
| 2014 | -- | $43,539 | $8,729 | $34,810 |
| 2013 | -- | $43,979 | $8,817 | $35,162 |
Source: Public Records
Map
Nearby Homes
- 206 E Washington St
- 616 Briarwood Ln
- 371 S Madison St
- 395 Danforth Dr
- 177 Franklin St
- 714 Pinehurst Ln
- 613 Murdock Place
- 388 Danforth Dr
- 423 Hathaway Ln
- 610 Murdock Place
- 611 Murdock Place
- 421 Hathaway Ln
- 55 Garfield St
- 101 Bell Ct
- 170 Chicago Rd
- 34 N Adams St
- 5055 U S 34
- 5161 US Highway 34
- 315 White Pines Ln
- 94 Templeton Dr
- 433 Prairieview Dr
- 429 Prairieview Dr
- 435 Prairieview Dr Unit 2
- 427 Prairieview Dr
- 437 Prairieview Dr Unit 2
- 425 Prairieview Dr
- 439 Prairieview Dr
- 423 Prairieview Dr
- 432 Prairieview Dr
- 426 Prairieview Dr
- 441 Prairieview Dr
- 421 Prairieview Dr
- 424 Prairieview Dr Unit 2
- 443 Prairieview Dr
- 107 Hickory St
- 419 Prairieview Dr
- 436 Prairieview Dr
- 360 E Benton St
- 445 Prairieview Dr
- 438 Prairieview Dr