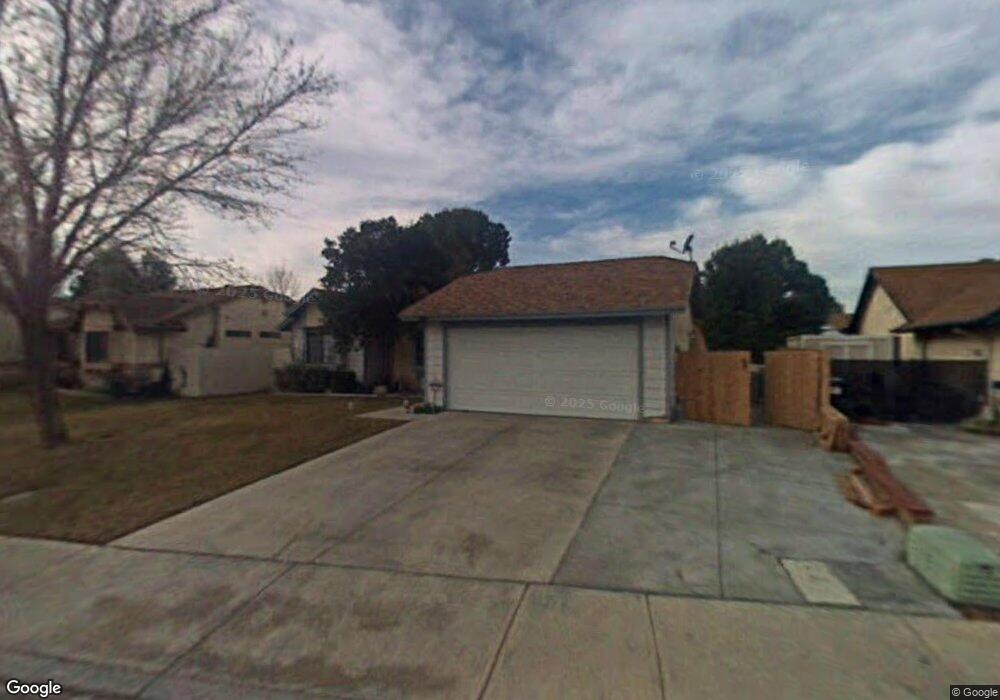
43107 21st St W Lancaster, CA 93536
West Lancaster NeighborhoodEstimated Value: $427,613 - $460,000
3
Beds
2
Baths
1,405
Sq Ft
$316/Sq Ft
Est. Value
About This Home
This home is located at 43107 21st St W, Lancaster, CA 93536 and is currently estimated at $443,903, approximately $315 per square foot. 43107 21st St W is a home located in Los Angeles County with nearby schools including Miller Elementary School, Amargosa Creek Middle School, and Lancaster High School.
Ownership History
Date
Name
Owned For
Owner Type
Purchase Details
Closed on
Aug 12, 1998
Sold by
Hud
Bought by
Robb Brian S
Current Estimated Value
Home Financials for this Owner
Home Financials are based on the most recent Mortgage that was taken out on this home.
Original Mortgage
$71,321
Outstanding Balance
$14,892
Interest Rate
6.93%
Estimated Equity
$429,011
Purchase Details
Closed on
May 19, 1998
Sold by
Norwest Mtg Inc
Bought by
Hud
Purchase Details
Closed on
Dec 8, 1997
Sold by
Padget Charles R and Norwest Mtg Inc
Bought by
Norwest Mtg Inc
Purchase Details
Closed on
Sep 25, 1995
Sold by
Calcut Thomas E and Calcut Lisa C
Bought by
Padget Charles R
Home Financials for this Owner
Home Financials are based on the most recent Mortgage that was taken out on this home.
Original Mortgage
$77,914
Interest Rate
7.42%
Mortgage Type
FHA
Create a Home Valuation Report for This Property
The Home Valuation Report is an in-depth analysis detailing your home's value as well as a comparison with similar homes in the area
Home Values in the Area
Average Home Value in this Area
Purchase History
| Date | Buyer | Sale Price | Title Company |
|---|---|---|---|
| Robb Brian S | $74,000 | First American Title Co | |
| Hud | -- | First American Title Ins Co | |
| Norwest Mtg Inc | $85,190 | First American Title Ins Co | |
| Padget Charles R | $77,000 | Fidelity National Title Ins |
Source: Public Records
Mortgage History
| Date | Status | Borrower | Loan Amount |
|---|---|---|---|
| Open | Robb Brian S | $71,321 | |
| Previous Owner | Padget Charles R | $77,914 |
Source: Public Records
Tax History Compared to Growth
Tax History
| Year | Tax Paid | Tax Assessment Tax Assessment Total Assessment is a certain percentage of the fair market value that is determined by local assessors to be the total taxable value of land and additions on the property. | Land | Improvement |
|---|---|---|---|---|
| 2025 | $3,161 | $151,336 | $24,756 | $126,580 |
| 2024 | $3,161 | $148,370 | $24,271 | $124,099 |
| 2023 | $3,097 | $145,462 | $23,796 | $121,666 |
| 2022 | $2,911 | $142,611 | $23,330 | $119,281 |
| 2021 | $2,529 | $139,816 | $22,873 | $116,943 |
| 2019 | $2,463 | $135,671 | $22,196 | $113,475 |
| 2018 | $2,420 | $133,011 | $21,761 | $111,250 |
| 2016 | $2,300 | $127,848 | $20,917 | $106,931 |
| 2015 | $2,274 | $125,928 | $20,603 | $105,325 |
| 2014 | $2,271 | $123,461 | $20,200 | $103,261 |
Source: Public Records
Map
Nearby Homes
- 43107 Sunny Ln
- 2011 W Avenue k10
- 2041 Kalliope Ave
- 2229 W Avenue k14
- 2235 W Avenue k14
- 100 W Avenue k14
- 1816 W Avenue k11
- 2230 W Avenue k14
- 43157 18th St W
- 43236 20th St W
- 1807 W Avenue k8
- 42934 Fenner Ave
- 43354 Sunny Ln
- 2324 W Avenue k15
- 1741 Viridan Ave
- 2051 W Avenue L
- 2300 W Avenue L
- 43203 Fanchon Ave
- 4 th W Avenue K 12
- 43308 18th St W
- 43111 21st St W
- 43103 21st St W
- 43116 Sunny Ln
- 43110 Sunny Ln
- 43122 Sunny Ln
- 2131 W Avenue k9
- 43112 21st St W
- 2138 W Avenue k9
- 43130 Sunny Ln
- 43104 Sunny Ln
- 2150 Limewood Ln
- 43118 21st St W
- 2134 W Avenue k9
- 2160 Limewood Ln
- 2123 W Avenue k9
- 43100 Sunny Ln
- 2130 Limewood Ln
- 2130 W Avenue k9
- 43115 Flag St
- 43111 Sunny Ln