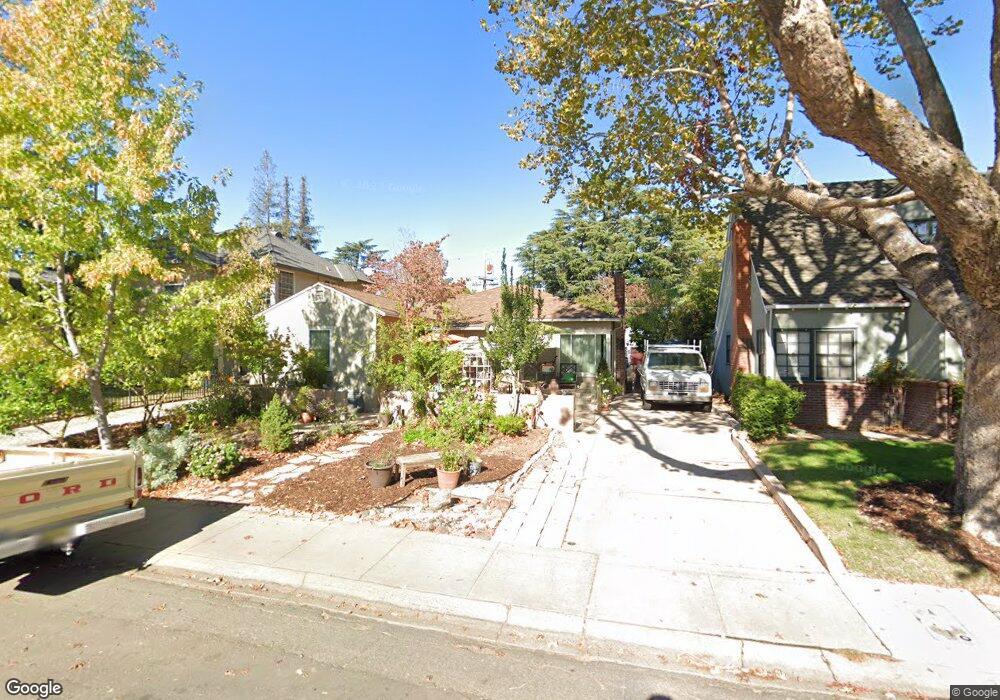
432 Pico Way Sacramento, CA 95819
East Sacramento NeighborhoodEstimated Value: $413,000 - $839,000
3
Beds
1
Bath
1,451
Sq Ft
$479/Sq Ft
Est. Value
About This Home
This home is located at 432 Pico Way, Sacramento, CA 95819 and is currently estimated at $694,888, approximately $478 per square foot. 432 Pico Way is a home located in Sacramento County with nearby schools including Caleb Greenwood Elementary, Miwok Middle School, and Hiram W. Johnson High School.
Ownership History
Date
Name
Owned For
Owner Type
Purchase Details
Closed on
Dec 21, 2011
Sold by
Aronhalt P Nikki
Bought by
Cole Claudette O
Current Estimated Value
Purchase Details
Closed on
Mar 11, 2009
Sold by
Swanberg Chrisman L and The Estate Of George Leland Ra
Bought by
Aronhalt P Nikki
Home Financials for this Owner
Home Financials are based on the most recent Mortgage that was taken out on this home.
Original Mortgage
$300,000
Interest Rate
5.19%
Mortgage Type
Purchase Money Mortgage
Create a Home Valuation Report for This Property
The Home Valuation Report is an in-depth analysis detailing your home's value as well as a comparison with similar homes in the area
Home Values in the Area
Average Home Value in this Area
Purchase History
| Date | Buyer | Sale Price | Title Company |
|---|---|---|---|
| Cole Claudette O | $349,000 | Old Republic Title Company | |
| Aronhalt P Nikki | $375,000 | Stewart Title Of Sacramento |
Source: Public Records
Mortgage History
| Date | Status | Borrower | Loan Amount |
|---|---|---|---|
| Previous Owner | Aronhalt P Nikki | $300,000 |
Source: Public Records
Tax History Compared to Growth
Tax History
| Year | Tax Paid | Tax Assessment Tax Assessment Total Assessment is a certain percentage of the fair market value that is determined by local assessors to be the total taxable value of land and additions on the property. | Land | Improvement |
|---|---|---|---|---|
| 2025 | $5,129 | $438,350 | $290,394 | $147,956 |
| 2024 | $5,129 | $429,755 | $284,700 | $145,055 |
| 2023 | $5,007 | $421,329 | $279,118 | $142,211 |
| 2022 | $4,922 | $413,069 | $273,646 | $139,423 |
| 2021 | $4,688 | $404,971 | $268,281 | $136,690 |
| 2020 | $4,726 | $400,820 | $265,531 | $135,289 |
| 2019 | $4,625 | $392,962 | $260,325 | $132,637 |
| 2018 | $4,504 | $385,258 | $255,221 | $130,037 |
| 2017 | $4,440 | $377,705 | $250,217 | $127,488 |
| 2016 | $4,336 | $370,300 | $245,311 | $124,989 |
| 2015 | $4,266 | $364,739 | $241,627 | $123,112 |
| 2014 | $4,150 | $357,595 | $236,894 | $120,701 |
Source: Public Records
Map
Nearby Homes