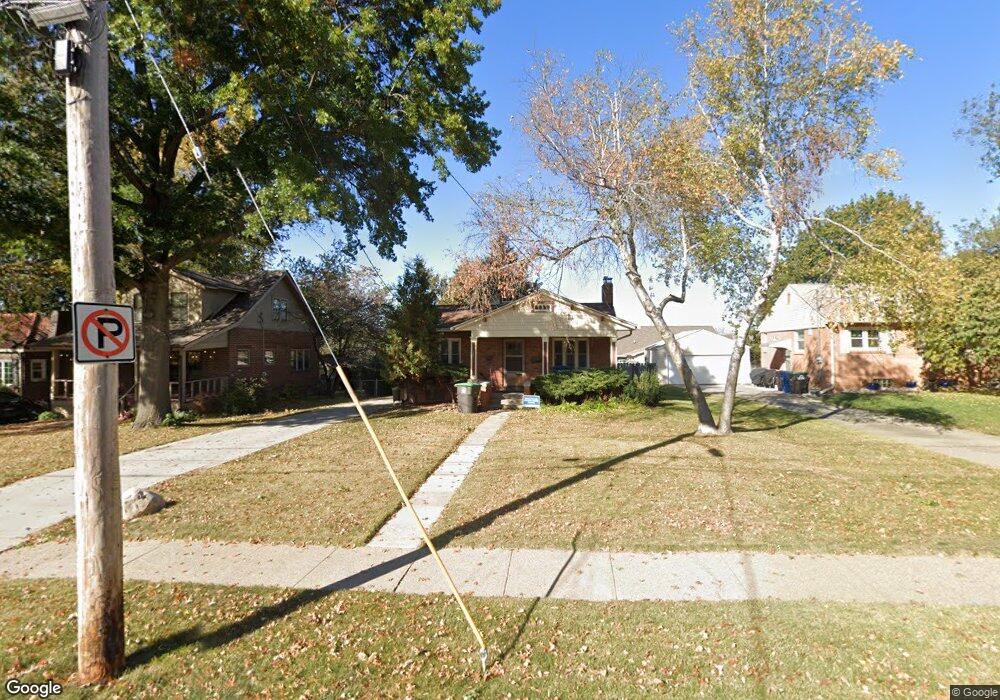
4321 Ovid Ave Des Moines, IA 50310
Beaverdale NeighborhoodEstimated Value: $205,000 - $236,000
2
Beds
1
Bath
826
Sq Ft
$265/Sq Ft
Est. Value
About This Home
This home is located at 4321 Ovid Ave, Des Moines, IA 50310 and is currently estimated at $218,644, approximately $264 per square foot. 4321 Ovid Ave is a home located in Polk County with nearby schools including Moore Elementary School, Meredith Middle School, and Hoover High School.
Ownership History
Date
Name
Owned For
Owner Type
Purchase Details
Closed on
Aug 16, 2022
Sold by
Ellen Taylor Mary
Bought by
Mary Ellen Taylor Living Trust
Current Estimated Value
Purchase Details
Closed on
Mar 28, 1998
Sold by
Barkley Melodie Ann
Bought by
Taylor Mary Ellen
Purchase Details
Closed on
Feb 23, 1998
Sold by
Barkley Melodie Ann
Bought by
Taylor Mary Ellen
Create a Home Valuation Report for This Property
The Home Valuation Report is an in-depth analysis detailing your home's value as well as a comparison with similar homes in the area
Home Values in the Area
Average Home Value in this Area
Purchase History
| Date | Buyer | Sale Price | Title Company |
|---|---|---|---|
| Mary Ellen Taylor Living Trust | -- | None Listed On Document | |
| Taylor Mary Ellen | $3,500 | -- | |
| Taylor Mary Ellen | $4,851 | -- |
Source: Public Records
Tax History Compared to Growth
Tax History
| Year | Tax Paid | Tax Assessment Tax Assessment Total Assessment is a certain percentage of the fair market value that is determined by local assessors to be the total taxable value of land and additions on the property. | Land | Improvement |
|---|---|---|---|---|
| 2025 | $2,822 | $212,500 | $65,000 | $147,500 |
| 2024 | $2,822 | $160,900 | $57,700 | $103,200 |
| 2023 | $3,410 | $188,900 | $57,700 | $131,200 |
| 2022 | $3,382 | $153,600 | $50,900 | $102,700 |
| 2021 | $3,344 | $153,600 | $50,900 | $102,700 |
| 2020 | $3,468 | $142,600 | $47,600 | $95,000 |
| 2019 | $3,214 | $142,600 | $47,600 | $95,000 |
| 2018 | $3,176 | $128,100 | $42,200 | $85,900 |
| 2017 | $2,848 | $128,100 | $42,200 | $85,900 |
| 2016 | $2,770 | $113,800 | $37,400 | $76,400 |
| 2015 | $2,770 | $113,800 | $37,400 | $76,400 |
| 2014 | $2,204 | $102,600 | $33,400 | $69,200 |
Source: Public Records
Map
Nearby Homes