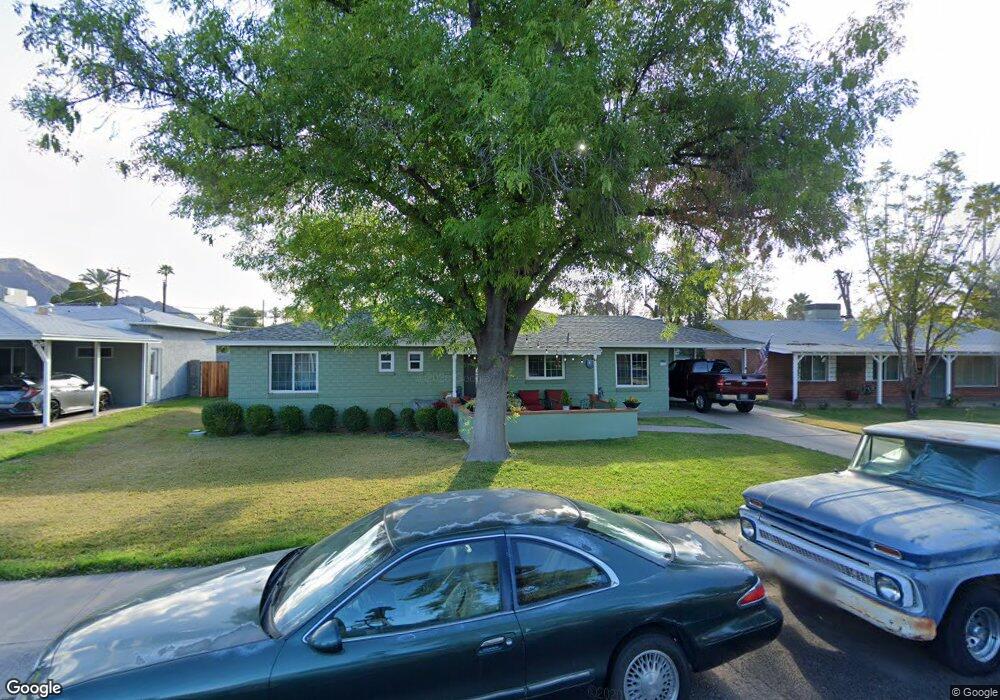
4325 N 41st St Phoenix, AZ 85018
Camelback East Village NeighborhoodEstimated Value: $712,670 - $1,371,000
--
Bed
2
Baths
1,392
Sq Ft
$667/Sq Ft
Est. Value
About This Home
This home is located at 4325 N 41st St, Phoenix, AZ 85018 and is currently estimated at $928,418, approximately $666 per square foot. 4325 N 41st St is a home located in Maricopa County with nearby schools including Hopi Elementary School, Ingleside Middle School, and Ombudsman - Charter East.
Ownership History
Date
Name
Owned For
Owner Type
Purchase Details
Closed on
Feb 22, 1994
Sold by
Sandmeyer John Jeffrey
Bought by
Mccartin Timothy M and Mccartin Salli A
Current Estimated Value
Home Financials for this Owner
Home Financials are based on the most recent Mortgage that was taken out on this home.
Original Mortgage
$78,400
Interest Rate
7.15%
Mortgage Type
FHA
Create a Home Valuation Report for This Property
The Home Valuation Report is an in-depth analysis detailing your home's value as well as a comparison with similar homes in the area
Home Values in the Area
Average Home Value in this Area
Purchase History
| Date | Buyer | Sale Price | Title Company |
|---|---|---|---|
| Mccartin Timothy M | -- | Lawyers Title | |
| Sandmeyer John Jeffrey | -- | Lawyers Title |
Source: Public Records
Mortgage History
| Date | Status | Borrower | Loan Amount |
|---|---|---|---|
| Closed | Mccartin Timothy M | $78,400 |
Source: Public Records
Tax History Compared to Growth
Tax History
| Year | Tax Paid | Tax Assessment Tax Assessment Total Assessment is a certain percentage of the fair market value that is determined by local assessors to be the total taxable value of land and additions on the property. | Land | Improvement |
|---|---|---|---|---|
| 2025 | $2,181 | $30,666 | -- | -- |
| 2024 | $2,022 | $29,206 | -- | -- |
| 2023 | $2,022 | $55,860 | $11,170 | $44,690 |
| 2022 | $1,948 | $43,720 | $8,740 | $34,980 |
| 2021 | $2,047 | $39,430 | $7,880 | $31,550 |
| 2020 | $2,015 | $34,760 | $6,950 | $27,810 |
| 2019 | $1,947 | $31,620 | $6,320 | $25,300 |
| 2018 | $1,885 | $30,010 | $6,000 | $24,010 |
| 2017 | $1,789 | $28,410 | $5,680 | $22,730 |
| 2016 | $1,740 | $26,880 | $5,370 | $21,510 |
| 2015 | $1,600 | $25,280 | $5,050 | $20,230 |
Source: Public Records
Map
Nearby Homes
- 4113 E Glenrosa Ave
- 4021 E Glenrosa Ave
- 4208 N 41st Place
- 4126 E Sells Dr
- 4202 N 41st Place
- 4316 N 40th St
- 4310 N 42nd Place
- 4145 E Campbell Ave
- 4301 E Montecito Ave
- 3923 E Heatherbrae Dr
- 4308 E Montecito Ave
- 4240 E Sells Dr
- 4119 E Monterosa St
- 4312 E Roma Ave
- 4525 N 40th St
- 4525 N 40th St Unit 7
- 4311 E Sells Dr
- 3913 E Campbell Ave
- 4203 E Hazelwood St
- 4419 N 43rd Place
- 4333 N 41st St
- 4315 N 41st St
- 4322 N 41st Place
- 4326 N 41st Place
- 4337 N 41st St
- 4035 E Montecito Ave
- 4028 E Montecito Ave
- 4332 N 41st Place
- 4330 N 41st St
- 4318 N 41st Place
- 4336 N 41st St
- 4031 E Montecito Ave
- 4336 N 41st Place
- 4044 E Glenrosa Ave
- 4111 E Montecito Ave
- 4038 E Turney Ave
- 4025 E Montecito Ave
- 4116 E Montecito Ave
- 4020 E Montecito Ave
- 4102 E Glenrosa Ave