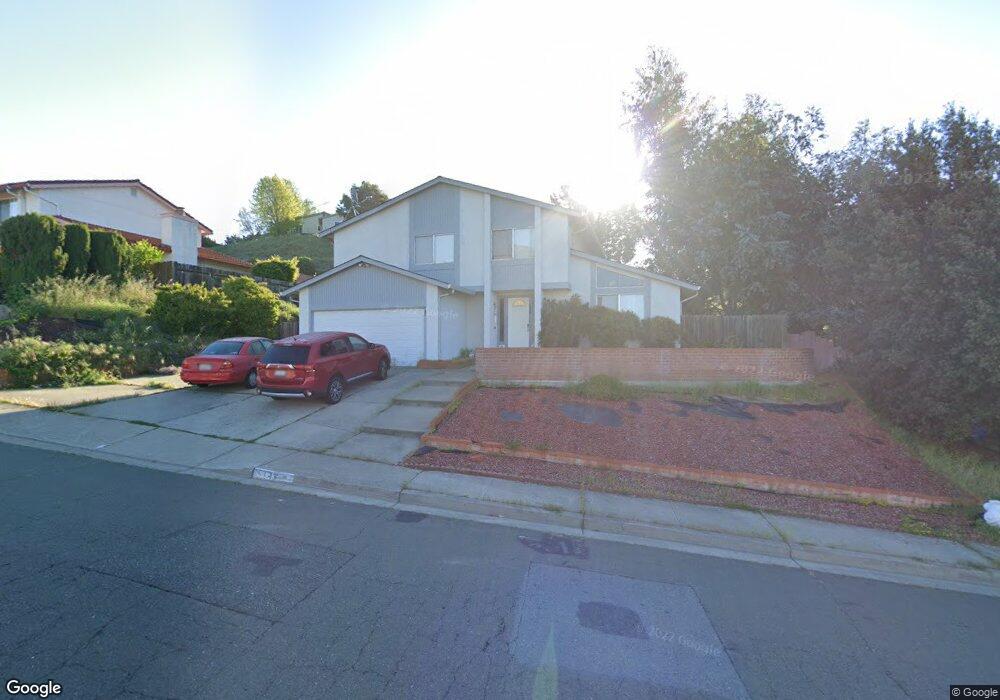
433 Violet Rd Hercules, CA 94547
Estimated Value: $846,000 - $905,000
4
Beds
3
Baths
1,927
Sq Ft
$449/Sq Ft
Est. Value
About This Home
This home is located at 433 Violet Rd, Hercules, CA 94547 and is currently estimated at $865,549, approximately $449 per square foot. 433 Violet Rd is a home located in Contra Costa County with nearby schools including Lupine Hills Elementary School, Hercules Middle School, and Hercules High School.
Ownership History
Date
Name
Owned For
Owner Type
Purchase Details
Closed on
Aug 25, 2018
Sold by
Symonds Marjorie and Symonds David
Bought by
Symonds David H and Symonds Marjorie E
Current Estimated Value
Purchase Details
Closed on
Nov 21, 2006
Sold by
Symonds Marjorie and Symonds David
Bought by
Symonds David and Symonds Marjorie
Home Financials for this Owner
Home Financials are based on the most recent Mortgage that was taken out on this home.
Original Mortgage
$487,000
Outstanding Balance
$298,620
Interest Rate
6.87%
Mortgage Type
Negative Amortization
Estimated Equity
$566,929
Purchase Details
Closed on
Feb 8, 2000
Sold by
Chang Yih Jen L
Bought by
Symonds David and Symonds Marjorie
Home Financials for this Owner
Home Financials are based on the most recent Mortgage that was taken out on this home.
Original Mortgage
$229,900
Interest Rate
6.5%
Mortgage Type
Purchase Money Mortgage
Create a Home Valuation Report for This Property
The Home Valuation Report is an in-depth analysis detailing your home's value as well as a comparison with similar homes in the area
Home Values in the Area
Average Home Value in this Area
Purchase History
| Date | Buyer | Sale Price | Title Company |
|---|---|---|---|
| Symonds David H | -- | None Available | |
| Symonds David | -- | Chicago Title Company | |
| Symonds David | $242,000 | Chicago Title Co |
Source: Public Records
Mortgage History
| Date | Status | Borrower | Loan Amount |
|---|---|---|---|
| Open | Symonds David | $487,000 | |
| Closed | Symonds David | $229,900 |
Source: Public Records
Tax History
| Year | Tax Paid | Tax Assessment Tax Assessment Total Assessment is a certain percentage of the fair market value that is determined by local assessors to be the total taxable value of land and additions on the property. | Land | Improvement |
|---|---|---|---|---|
| 2025 | $6,561 | $371,924 | $169,056 | $202,868 |
| 2024 | $6,161 | $364,633 | $165,742 | $198,891 |
| 2023 | $6,161 | $357,485 | $162,493 | $194,992 |
| 2022 | $6,091 | $350,476 | $159,307 | $191,169 |
| 2021 | $6,082 | $343,605 | $156,184 | $187,421 |
| 2019 | $5,788 | $333,415 | $151,552 | $181,863 |
| 2018 | $5,628 | $326,879 | $148,581 | $178,298 |
| 2017 | $5,548 | $320,470 | $145,668 | $174,802 |
| 2016 | $5,389 | $314,187 | $142,812 | $171,375 |
| 2015 | $5,397 | $309,468 | $140,667 | $168,801 |
| 2014 | $5,658 | $303,407 | $137,912 | $165,495 |
Source: Public Records
Map
Nearby Homes
- 161 Seaway Ct
- 121 Fir Ct
- 301 Boatswain Ct
- 103 Tuscany Ct
- 256 Napoli Ct Unit 256
- 147 Vierra Way
- 832 Windward Dr
- 720 Seacliff Ct
- 890 Tradewind Ln
- 518 Silver Maple Dr
- 405 Weymouth
- 120 Bonita Ct
- 922 Coral Dr
- 704 Windsor Unit 704
- 801 Dover
- 797 Coral Ridge Cir
- 943 Coral Ridge Cir
- 1212 Stirling Dr
- 1204 Stirling Dr
- 834 Coral Ridge Cir
Your Personal Tour Guide
Ask me questions while you tour the home.