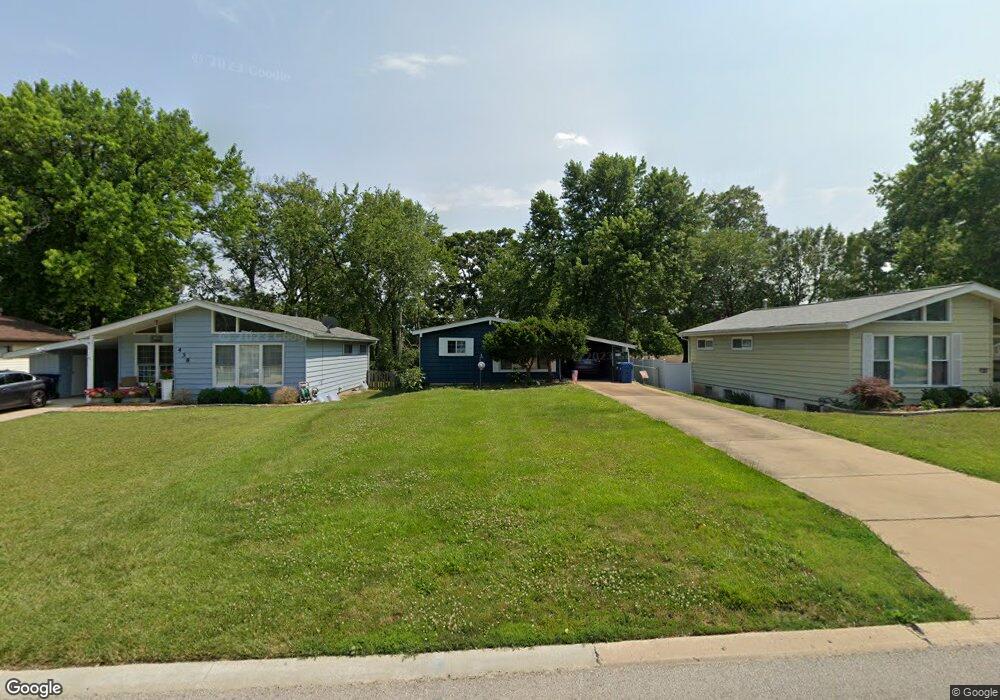
434 Orchard Ave Ballwin, MO 63021
Estimated Value: $229,998 - $259,000
3
Beds
1
Bath
1,000
Sq Ft
$241/Sq Ft
Est. Value
About This Home
This home is located at 434 Orchard Ave, Ballwin, MO 63021 and is currently estimated at $241,250, approximately $241 per square foot. 434 Orchard Ave is a home located in St. Louis County with nearby schools including Sorrento Springs Elementary School, Parkway Southwest Middle School, and Parkway South High School.
Ownership History
Date
Name
Owned For
Owner Type
Purchase Details
Closed on
Jan 14, 2014
Sold by
Pfohl Thomas Logan and Pfohl Percy W
Bought by
Famous Nancy M
Current Estimated Value
Home Financials for this Owner
Home Financials are based on the most recent Mortgage that was taken out on this home.
Original Mortgage
$104,500
Outstanding Balance
$79,133
Interest Rate
4.47%
Mortgage Type
New Conventional
Estimated Equity
$162,117
Purchase Details
Closed on
Apr 20, 2000
Sold by
Pfohl Percy Wayne and Pfohl Melva Jean
Bought by
Pfohl Thomas Logan and Pfohl Deinice Marie
Purchase Details
Closed on
Apr 14, 2000
Sold by
Pfohl John Kenneth and Pfohl Susan Jean
Bought by
Pfohl Thomas Logan and Pfohl Deinice Marie
Purchase Details
Closed on
Apr 7, 2000
Sold by
Alan Pfohl Bruce
Bought by
Pfohl Thomas Logan and Pfohl Deinice Marie
Purchase Details
Closed on
Apr 3, 2000
Sold by
Pfohl Donna Jean
Bought by
Pfohl Thomas Logan and Pfohl Deinice Marie
Create a Home Valuation Report for This Property
The Home Valuation Report is an in-depth analysis detailing your home's value as well as a comparison with similar homes in the area
Home Values in the Area
Average Home Value in this Area
Purchase History
| Date | Buyer | Sale Price | Title Company |
|---|---|---|---|
| Famous Nancy M | $110,000 | Investors Title Co Clayton | |
| Pfohl Thomas L | -- | Investors Title Co Clayton | |
| Pfohl Thomas Logan | -- | -- | |
| Pfohl Thomas Logan | -- | -- | |
| Pfohl Thomas Logan | -- | -- | |
| Pfohl Thomas Logan | -- | -- | |
| Pfohl Thomas Logan | -- | -- |
Source: Public Records
Mortgage History
| Date | Status | Borrower | Loan Amount |
|---|---|---|---|
| Open | Famous Nancy M | $104,500 |
Source: Public Records
Tax History
| Year | Tax Paid | Tax Assessment Tax Assessment Total Assessment is a certain percentage of the fair market value that is determined by local assessors to be the total taxable value of land and additions on the property. | Land | Improvement |
|---|---|---|---|---|
| 2025 | $2,303 | $37,510 | $23,940 | $13,570 |
| 2024 | $2,303 | $34,910 | $17,960 | $16,950 |
| 2023 | $2,324 | $34,910 | $17,960 | $16,950 |
| 2022 | $2,252 | $31,010 | $17,960 | $13,050 |
| 2021 | $2,240 | $31,010 | $17,960 | $13,050 |
| 2020 | $1,911 | $25,260 | $14,520 | $10,740 |
| 2019 | $1,889 | $25,260 | $14,520 | $10,740 |
| 2018 | $1,907 | $23,600 | $11,650 | $11,950 |
| 2017 | $1,886 | $23,600 | $11,650 | $11,950 |
| 2016 | $1,559 | $18,470 | $9,750 | $8,720 |
Source: Public Records
Map
Nearby Homes
- 312 Ballwin Ave
- 313 Saint Lawrence Dr
- 212 Lakeside Dr
- 212 Lindy Blvd
- 44 Saint Lawrence Dr
- 3 Chappel Ct
- 604 Nandale Ln
- 322 Old Meramec Station Rd
- 0 Unknown Unit MIS25060078
- 0 Unknown Unit MIS25060104
- 0 Unknown Unit MIS25060076
- 0 Unknown Unit MIS25060105
- 0 Unknown Unit MIS25060100
- 0 Unknown Unit MIS25060079
- 0 Unknown Unit MIS25060108
- 0 Unknown Unit MIS25060103
- 0 Unknown Unit MIS25060077
- 729 Tuscan Valley Ct
- 804 Joyceann Dr
- 429 Fairview Ct
- 438 Orchard Ave
- 430 Orchard Ave
- 442 Orchard Ave
- 424 Orchard Ave
- 30 Winchester Place Lot Uc
- 30Lot UC Winchester Place
- 433 Hillcrest Blvd
- 420 Orchard Ave
- 429 Hillcrest Blvd
- 437 Hillcrest Blvd
- 441 Hillcrest Blvd
- 425 Hillcrest Blvd
- 416 Orchard Ave
- 433 Orchard Ave
- 437 Orchard Ave
- 429 Orchard Ave
- 441 Orchard Ave
- 425 Orchard Ave
- 444 Orchard Ave
- 417 Hillcrest Blvd
Your Personal Tour Guide
Ask me questions while you tour the home.