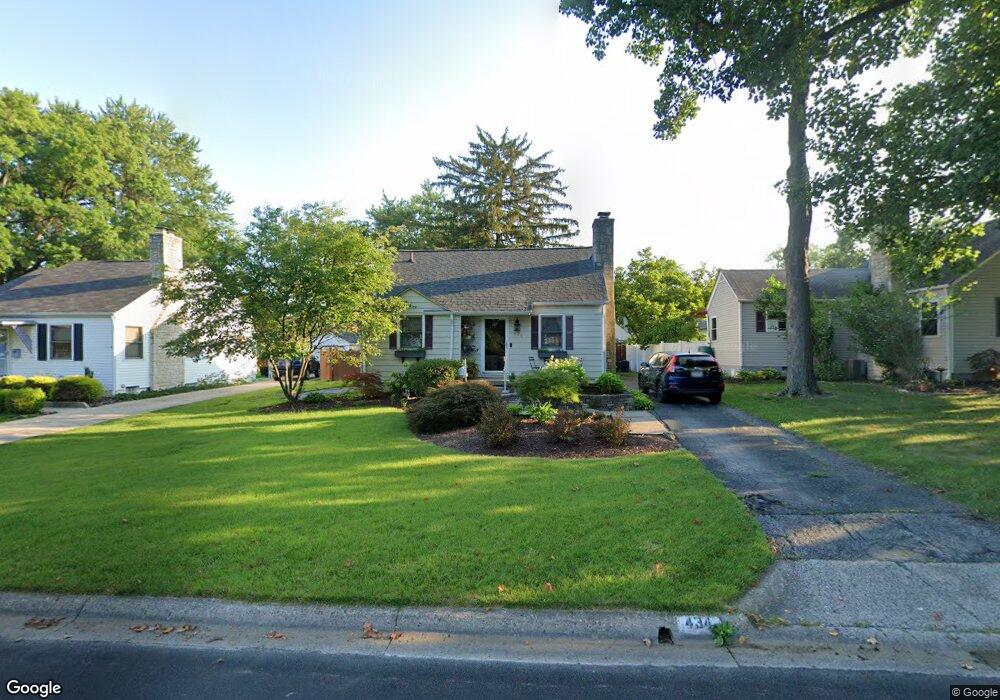
434 Wetmore Rd Columbus, OH 43214
Clintonville NeighborhoodEstimated Value: $339,000 - $388,000
2
Beds
2
Baths
1,158
Sq Ft
$313/Sq Ft
Est. Value
About This Home
This home is located at 434 Wetmore Rd, Columbus, OH 43214 and is currently estimated at $361,973, approximately $312 per square foot. 434 Wetmore Rd is a home located in Franklin County with nearby schools including Colerain Elementary School, Dominion Middle School, and Whetstone High School.
Ownership History
Date
Name
Owned For
Owner Type
Purchase Details
Closed on
Feb 5, 2015
Sold by
Bradigan Blair K and Bradigan Christina L
Bought by
Andrews Cami J and Andrews Bradley C
Current Estimated Value
Home Financials for this Owner
Home Financials are based on the most recent Mortgage that was taken out on this home.
Original Mortgage
$132,000
Outstanding Balance
$100,953
Interest Rate
3.72%
Mortgage Type
New Conventional
Estimated Equity
$261,020
Purchase Details
Closed on
May 15, 2009
Sold by
Pierce Ty M and Pierce Alayna C
Bought by
Bradigan Blair K and Bradigan Christina L
Home Financials for this Owner
Home Financials are based on the most recent Mortgage that was taken out on this home.
Original Mortgage
$161,029
Interest Rate
4.84%
Mortgage Type
FHA
Purchase Details
Closed on
Jan 14, 2005
Sold by
Hardesty Tedd N and Hardesty Kimberly K
Bought by
Pierce Ty M and Pierce Alayna C
Home Financials for this Owner
Home Financials are based on the most recent Mortgage that was taken out on this home.
Original Mortgage
$30,200
Interest Rate
5.77%
Mortgage Type
Credit Line Revolving
Purchase Details
Closed on
Dec 6, 1993
Purchase Details
Closed on
Jan 31, 1991
Create a Home Valuation Report for This Property
The Home Valuation Report is an in-depth analysis detailing your home's value as well as a comparison with similar homes in the area
Home Values in the Area
Average Home Value in this Area
Purchase History
| Date | Buyer | Sale Price | Title Company |
|---|---|---|---|
| Andrews Cami J | $165,000 | None Available | |
| Bradigan Blair K | $164,000 | Real Living | |
| Pierce Ty M | $151,000 | -- | |
| -- | $81,300 | -- | |
| -- | -- | -- |
Source: Public Records
Mortgage History
| Date | Status | Borrower | Loan Amount |
|---|---|---|---|
| Open | Andrews Cami J | $132,000 | |
| Previous Owner | Bradigan Blair K | $161,029 | |
| Previous Owner | Pierce Ty M | $30,200 |
Source: Public Records
Tax History Compared to Growth
Tax History
| Year | Tax Paid | Tax Assessment Tax Assessment Total Assessment is a certain percentage of the fair market value that is determined by local assessors to be the total taxable value of land and additions on the property. | Land | Improvement |
|---|---|---|---|---|
| 2024 | $4,812 | $107,210 | $54,850 | $52,360 |
| 2023 | $4,750 | $107,205 | $54,845 | $52,360 |
| 2022 | $4,678 | $90,200 | $44,310 | $45,890 |
| 2021 | $4,687 | $90,200 | $44,310 | $45,890 |
| 2020 | $4,693 | $90,200 | $44,310 | $45,890 |
| 2019 | $4,170 | $68,740 | $34,090 | $34,650 |
| 2018 | $3,796 | $68,740 | $34,090 | $34,650 |
| 2017 | $3,974 | $68,740 | $34,090 | $34,650 |
| 2016 | $3,780 | $57,060 | $19,780 | $37,280 |
| 2015 | $3,431 | $57,060 | $19,780 | $37,280 |
| 2014 | $3,440 | $57,060 | $19,780 | $37,280 |
| 2013 | $1,615 | $54,320 | $18,830 | $35,490 |
Source: Public Records
Map
Nearby Homes
- 420 E Beechwold Blvd
- 381 E Jeffrey Place
- 343 E Jeffrey Place
- 411 Garden Rd
- 475 Garden Rd
- 224 Morse Rd
- 646 E Beechwold Blvd
- 601 Morse Rd
- 247 E Jeffrey Place
- 255 Garden Rd
- 278 E Dominion Blvd
- 156 E Weisheimer Rd
- 134 E Jeffrey Place
- 4299 Colerain Ave
- 243 E Schreyer Place
- 4508 Glenmawr Ave
- 4193 Eastlea Dr
- 4 W Royal Forest Blvd
- 26 E Schreyer Place
- 814 Meadowview Dr
- 442 Wetmore Rd
- 426 Wetmore Rd
- 450 Wetmore Rd
- 418 Wetmore Rd
- 0 Wetmore Rd
- 435 E Beechwold Blvd
- 458 Wetmore Rd
- 429 E Beechwold Blvd
- 439 E Beechwold Blvd
- 425 E Beechwold Blvd
- 445 E Beechwold Blvd
- 417 E Beechwold Blvd
- 451 E Beechwold Blvd
- 437 Wetmore Rd
- 427 Wetmore Rd
- 413 E Beechwold Blvd
- 466 Wetmore Rd
- 457 E Beechwold Blvd
- 443 Wetmore Rd
- 421 Wetmore Rd