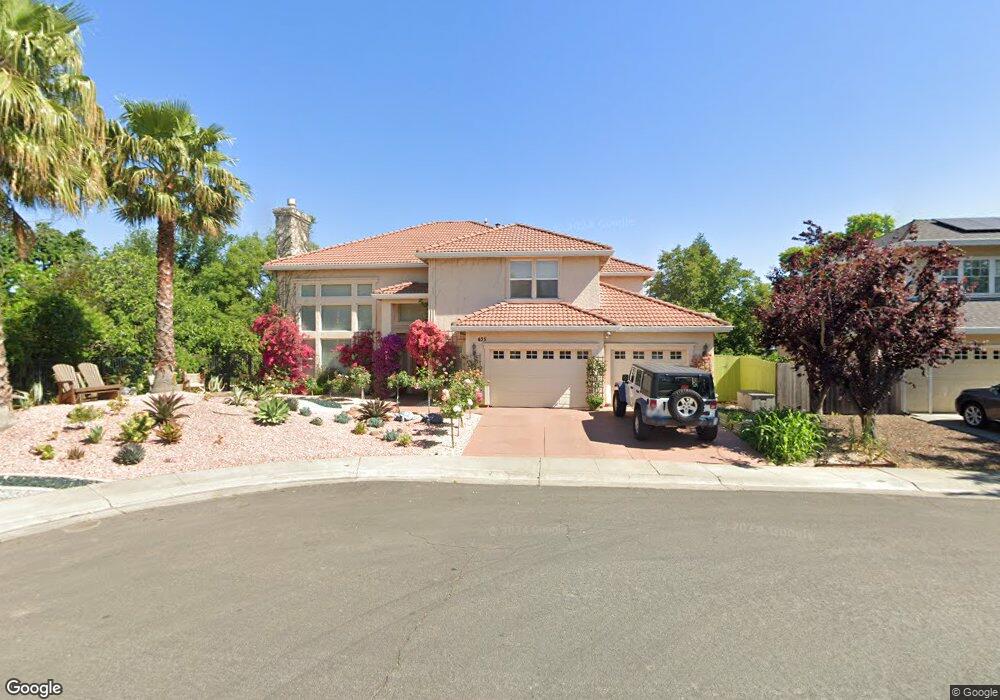
435 Merganser Place Davis, CA 95616
North Davis NeighborhoodEstimated Value: $1,190,000 - $1,499,000
5
Beds
3
Baths
3,592
Sq Ft
$377/Sq Ft
Est. Value
About This Home
This home is located at 435 Merganser Place, Davis, CA 95616 and is currently estimated at $1,352,515, approximately $376 per square foot. 435 Merganser Place is a home located in Yolo County with nearby schools including North Davis Elementary School, Oliver Wendell Holmes Junior High School, and Davis Senior High School.
Ownership History
Date
Name
Owned For
Owner Type
Purchase Details
Closed on
Jul 12, 2018
Sold by
Erwin Robert L and Erwin Iryna S
Bought by
Erwin Robert and Erwin Iryna
Current Estimated Value
Purchase Details
Closed on
May 12, 2001
Sold by
Erwin Robert L
Bought by
Erwin Robert L and Erwin Iryna S
Purchase Details
Closed on
May 4, 2000
Sold by
Shemchuk Iryna S
Bought by
Erwin Robert L
Home Financials for this Owner
Home Financials are based on the most recent Mortgage that was taken out on this home.
Original Mortgage
$367,600
Outstanding Balance
$114,249
Interest Rate
7.55%
Estimated Equity
$1,238,266
Purchase Details
Closed on
May 2, 2000
Sold by
Ghorbanzadeh Ali & Mahvash Tr
Bought by
Erwin Robert L
Home Financials for this Owner
Home Financials are based on the most recent Mortgage that was taken out on this home.
Original Mortgage
$367,600
Outstanding Balance
$114,249
Interest Rate
7.55%
Estimated Equity
$1,238,266
Create a Home Valuation Report for This Property
The Home Valuation Report is an in-depth analysis detailing your home's value as well as a comparison with similar homes in the area
Home Values in the Area
Average Home Value in this Area
Purchase History
| Date | Buyer | Sale Price | Title Company |
|---|---|---|---|
| Erwin Robert | -- | None Available | |
| Erwin Robert L | -- | -- | |
| Erwin Robert L | -- | Placer Title Company | |
| Erwin Robert L | $459,500 | Placer Title Company |
Source: Public Records
Mortgage History
| Date | Status | Borrower | Loan Amount |
|---|---|---|---|
| Open | Erwin Robert L | $367,600 |
Source: Public Records
Tax History
| Year | Tax Paid | Tax Assessment Tax Assessment Total Assessment is a certain percentage of the fair market value that is determined by local assessors to be the total taxable value of land and additions on the property. | Land | Improvement |
|---|---|---|---|---|
| 2025 | $10,753 | $755,946 | $206,813 | $549,133 |
| 2023 | $10,753 | $726,593 | $198,783 | $527,810 |
| 2022 | $10,367 | $712,347 | $194,886 | $517,461 |
| 2021 | $10,165 | $698,380 | $191,065 | $507,315 |
| 2020 | $10,006 | $691,220 | $189,106 | $502,114 |
| 2019 | $9,658 | $677,668 | $185,399 | $492,269 |
| 2018 | $9,078 | $664,381 | $181,764 | $482,617 |
| 2017 | $8,934 | $651,354 | $178,200 | $473,154 |
| 2016 | $8,756 | $638,583 | $174,706 | $463,877 |
| 2015 | $8,511 | $628,992 | $172,082 | $456,910 |
| 2014 | $8,511 | $616,672 | $168,712 | $447,960 |
Source: Public Records
Map
Nearby Homes
- 529 Flicker Ave
- 103 Grande Ave
- 824 Harrier Place
- 2818 Anza Ave
- 819 Falcon Ave
- 116 Huerta Place
- 404 Cabrillo Ave
- 3117 Northfield Ct
- 813 Barcelona Ave
- 1952 Cannery Loop
- 2230 Cannery Loop
- 771 Bianco Ct
- 1821 Cannery Loop
- 1037 Forbes Ln
- 2248 Cannery Loop
- 2181 Bella Casa St
- 1769 Cannery Loop
- 2128 Bueno Dr Unit 18
- 1731 Heirloom St
- 2007 Alta Loma St
- 429 Merganser Place
- 432 Sandpiper Dr
- 426 Sandpiper Dr
- 423 Merganser Place
- 434 Merganser Place
- 503 Waxwing Place
- 420 Sandpiper Dr
- 428 Merganser Place
- 504 Mockingbird Place
- 417 Merganser Place
- 422 Merganser Place
- 502 Waxwing Place
- 414 Sandpiper Dr
- 509 Waxwing Place
- 427 Sandpiper Dr
- 421 Sandpiper Dr
- 510 Mockingbird Place
- 413 Merganser Place
- 415 Sandpiper Dr
- 508 Waxwing Place
Your Personal Tour Guide
Ask me questions while you tour the home.