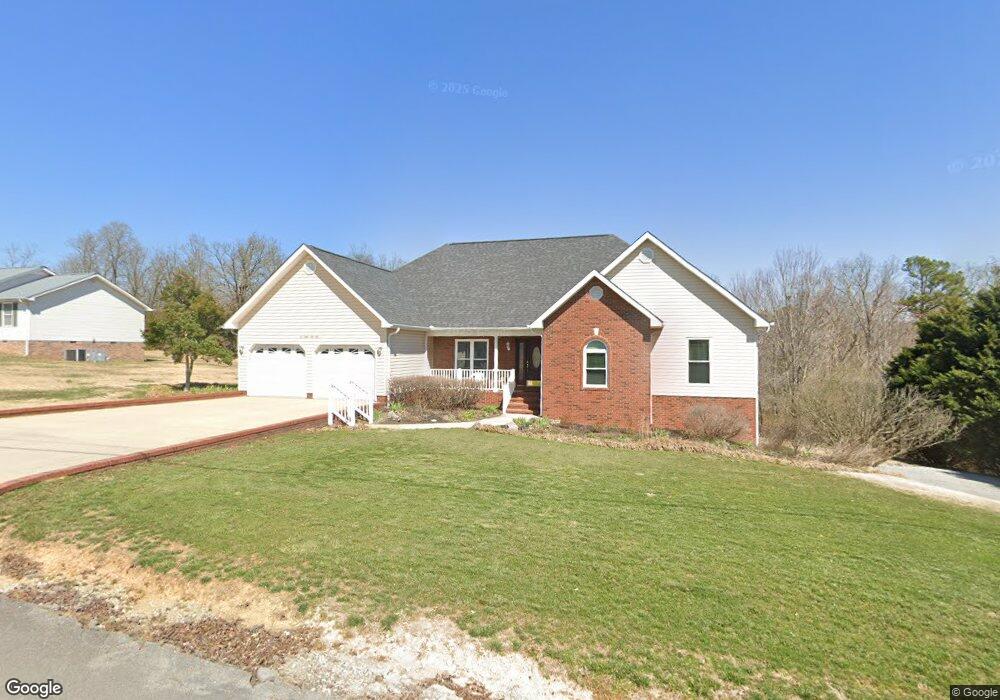
435 Summit Ridge Rd Dunlap, TN 37327
Estimated Value: $324,000 - $412,000
3
Beds
3
Baths
2,560
Sq Ft
$143/Sq Ft
Est. Value
About This Home
This home is located at 435 Summit Ridge Rd, Dunlap, TN 37327 and is currently estimated at $365,685, approximately $142 per square foot. 435 Summit Ridge Rd is a home located in Sequatchie County with nearby schools including Griffith Elementary School, Sequatchie County Middle School, and Sequatchie County High School.
Ownership History
Date
Name
Owned For
Owner Type
Purchase Details
Closed on
May 3, 2021
Sold by
Wesley Carolyn M and Wesley Family Trust
Bought by
Wesley Patricia
Current Estimated Value
Home Financials for this Owner
Home Financials are based on the most recent Mortgage that was taken out on this home.
Original Mortgage
$225,000
Outstanding Balance
$202,265
Interest Rate
3%
Mortgage Type
Purchase Money Mortgage
Estimated Equity
$163,420
Purchase Details
Closed on
Oct 23, 2006
Sold by
Richard Dine
Bought by
Wesley Carolyn M Trustee Of
Purchase Details
Closed on
Jan 10, 2005
Sold by
Smith Benton E
Bought by
Richard Dine
Purchase Details
Closed on
Oct 19, 1998
Sold by
Ben Dean Charles and Ben Wife
Bought by
Smith Benton E and Smith Juanita
Purchase Details
Closed on
Jan 28, 1994
Bought by
Dean Charles Ben and Wife Cleo
Create a Home Valuation Report for This Property
The Home Valuation Report is an in-depth analysis detailing your home's value as well as a comparison with similar homes in the area
Home Values in the Area
Average Home Value in this Area
Purchase History
| Date | Buyer | Sale Price | Title Company |
|---|---|---|---|
| Wesley Patricia | $227,054 | None Available | |
| Wesley Carolyn M Trustee Of | $207,000 | -- | |
| Richard Dine | $176,000 | -- | |
| Smith Benton E | $8,000 | -- | |
| Dean Charles Ben | $110,000 | -- |
Source: Public Records
Mortgage History
| Date | Status | Borrower | Loan Amount |
|---|---|---|---|
| Open | Wesley Patricia | $225,000 |
Source: Public Records
Tax History
| Year | Tax Paid | Tax Assessment Tax Assessment Total Assessment is a certain percentage of the fair market value that is determined by local assessors to be the total taxable value of land and additions on the property. | Land | Improvement |
|---|---|---|---|---|
| 2025 | $1,638 | $67,825 | $4,300 | $63,525 |
| 2024 | $1,638 | $67,825 | $4,300 | $63,525 |
| 2023 | $1,638 | $67,825 | $4,300 | $63,525 |
| 2022 | $1,376 | $41,475 | $3,050 | $38,425 |
| 2021 | $1,356 | $41,475 | $3,050 | $38,425 |
| 2020 | $1,356 | $41,475 | $3,050 | $38,425 |
| 2019 | $1,356 | $41,475 | $3,050 | $38,425 |
| 2018 | $1,340 | $41,475 | $3,050 | $38,425 |
| 2017 | $1,325 | $41,475 | $3,050 | $38,425 |
| 2016 | $1,387 | $41,650 | $3,050 | $38,600 |
| 2015 | $1,387 | $41,650 | $3,050 | $38,600 |
| 2014 | $1,387 | $41,650 | $3,050 | $38,600 |
Source: Public Records
Map
Nearby Homes
- Lot 36 River Ridge Dr
- 2 Fredonia Rd
- 95 A Main St
- 1 Fredonia Rd
- 3 Fredonia Rd
- 453 Hill Cir
- 0 State Rt 399 Lot 13
- 267 Williams Rd
- 217 A Day Dream Dr
- 0 SE US Hwy 127 Unit 1519993
- 0 SE US Hwy 127 Unit 1519990
- 0 SE US Hwy 127 Unit 1519988
- 0 SE US Hwy 127 Unit 1314389
- 0 SE US Hwy 127 Unit 1519979
- 0 SE US Hwy 127 Unit 1519991
- 0 SE US Hwy 127 Unit 1519984
- 21550 U S 127
- 21552 U S 127
- 11342 Fredonia Rd
- 21 Fredonia Rd
- 409 Summit Ridge Rd
- 460 Summit Ridge Rd
- 461 Summit Ridge Rd
- 398 Summit Ridge Rd
- 461 Summit Ridge Rd
- 9 Hobbs Ridge Rd
- 96 Summit Ridge Rd
- 100 Summit Ridge Rd
- 8 Hobbs Ridge Rd
- 6 Hobbs Ridge Rd
- 7 Hobbs Ridge Rd
- 5 Hobbs Ridge Rd
- 387 Hobbs Ridge Rd
- 4 Hobbs Ridge Rd
- 2 Hobbs Ridge Rd
- 1 Hobbs Ridge Rd
- 124 Hook St
- 0 Summit Ridge Rd Unit 1319377
- 0 Summit Ridge Rd
- 370 Summit Ridge Rd
Your Personal Tour Guide
Ask me questions while you tour the home.