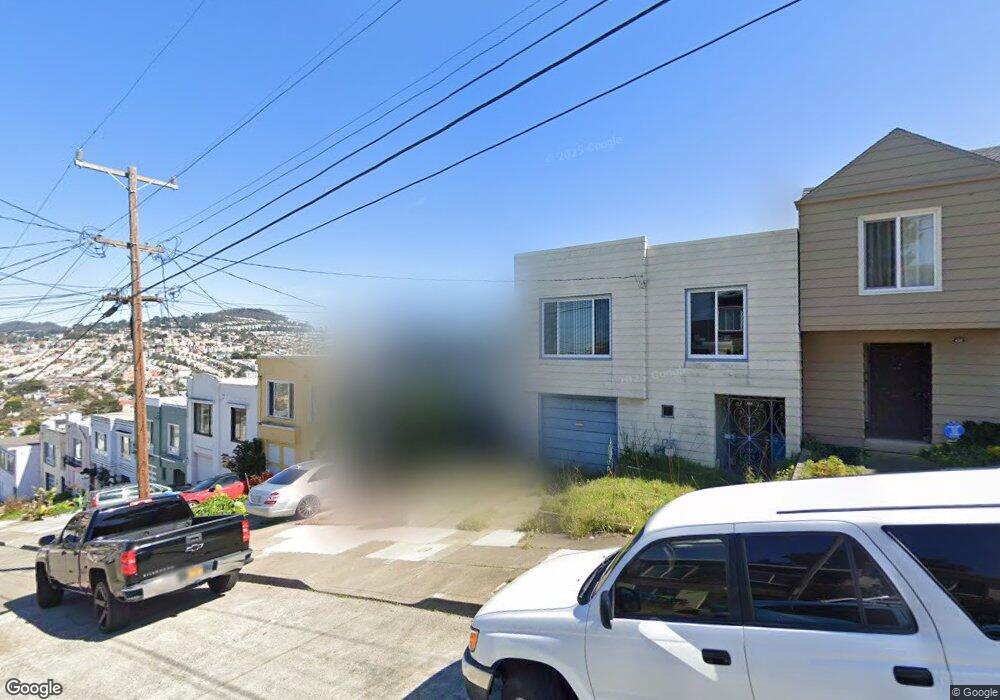
438 Arch St San Francisco, CA 94132
Merced Heights NeighborhoodEstimated Value: $934,485 - $1,141,000
2
Beds
1
Bath
875
Sq Ft
$1,210/Sq Ft
Est. Value
About This Home
This home is located at 438 Arch St, San Francisco, CA 94132 and is currently estimated at $1,058,621, approximately $1,209 per square foot. 438 Arch St is a home located in San Francisco County with nearby schools including Ortega (Jose) Elementary School, Aptos Middle School, and Stratford School.
Ownership History
Date
Name
Owned For
Owner Type
Purchase Details
Closed on
Dec 27, 2019
Sold by
Murcehajic Sabit and Murcehajic Jasminka
Bought by
Murcehajic Amir and Ruiz Yvonne
Current Estimated Value
Purchase Details
Closed on
Nov 18, 1996
Sold by
Dolores Velazquez
Bought by
Murcehajic Sabit and Murcehajic Jasminka
Home Financials for this Owner
Home Financials are based on the most recent Mortgage that was taken out on this home.
Original Mortgage
$152,250
Outstanding Balance
$14,727
Interest Rate
7.88%
Estimated Equity
$1,043,894
Create a Home Valuation Report for This Property
The Home Valuation Report is an in-depth analysis detailing your home's value as well as a comparison with similar homes in the area
Home Values in the Area
Average Home Value in this Area
Purchase History
| Date | Buyer | Sale Price | Title Company |
|---|---|---|---|
| Murcehajic Amir | -- | None Available | |
| Murcehajic Sabit | $203,000 | Fidelity National Title Co |
Source: Public Records
Mortgage History
| Date | Status | Borrower | Loan Amount |
|---|---|---|---|
| Open | Murcehajic Sabit | $152,250 |
Source: Public Records
Tax History Compared to Growth
Tax History
| Year | Tax Paid | Tax Assessment Tax Assessment Total Assessment is a certain percentage of the fair market value that is determined by local assessors to be the total taxable value of land and additions on the property. | Land | Improvement |
|---|---|---|---|---|
| 2025 | $4,586 | $330,599 | $228,005 | $102,594 |
| 2024 | $4,586 | $324,118 | $223,535 | $100,583 |
| 2023 | $4,508 | $317,763 | $219,152 | $98,611 |
| 2022 | $4,408 | $311,533 | $214,855 | $96,678 |
| 2021 | $4,325 | $305,426 | $210,643 | $94,783 |
| 2020 | $4,279 | $302,296 | $208,484 | $93,812 |
| 2019 | $4,135 | $296,370 | $204,397 | $91,973 |
| 2018 | $3,996 | $290,560 | $200,390 | $90,170 |
| 2017 | $3,649 | $284,863 | $196,461 | $88,402 |
| 2016 | $3,563 | $279,278 | $192,609 | $86,669 |
| 2015 | $3,516 | $275,084 | $189,716 | $85,368 |
| 2014 | $3,423 | $269,696 | $186,000 | $83,696 |
Source: Public Records
Map
Nearby Homes