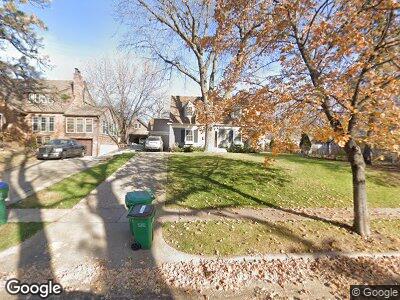
4383 Dart Ave Saint Louis Park, MN 55424
Browndale NeighborhoodEstimated Value: $784,000 - $1,014,000
3
Beds
3
Baths
1,828
Sq Ft
$476/Sq Ft
Est. Value
About This Home
This home is located at 4383 Dart Ave, Saint Louis Park, MN 55424 and is currently estimated at $869,315, approximately $475 per square foot. 4383 Dart Ave is a home located in Hennepin County with nearby schools including Susan Lindgren Elementary School, St. Louis Park Middle School, and St. Louis Park High School.
Ownership History
Date
Name
Owned For
Owner Type
Purchase Details
Closed on
Jul 15, 2015
Sold by
Evanoff Kimberly C and Evanoff Nikolas J
Bought by
Cormier Quinn Christopher
Current Estimated Value
Home Financials for this Owner
Home Financials are based on the most recent Mortgage that was taken out on this home.
Original Mortgage
$410,000
Interest Rate
3.82%
Mortgage Type
New Conventional
Purchase Details
Closed on
Aug 24, 2012
Sold by
Olso Jon Kai
Bought by
Evanoff Kimberly C and Evanoff Nikolas J
Home Financials for this Owner
Home Financials are based on the most recent Mortgage that was taken out on this home.
Original Mortgage
$417,000
Interest Rate
3.52%
Mortgage Type
New Conventional
Purchase Details
Closed on
Sep 26, 2011
Sold by
Olson Jon Kai
Bought by
Olson Jon Kai
Create a Home Valuation Report for This Property
The Home Valuation Report is an in-depth analysis detailing your home's value as well as a comparison with similar homes in the area
Home Values in the Area
Average Home Value in this Area
Purchase History
| Date | Buyer | Sale Price | Title Company |
|---|---|---|---|
| Cormier Quinn Christopher | $620,000 | All American Title Company | |
| Evanoff Kimberly C | $479,000 | None Available | |
| Olson Jon Kai | -- | None Available |
Source: Public Records
Mortgage History
| Date | Status | Borrower | Loan Amount |
|---|---|---|---|
| Open | Cormier Quinn Christopher | $360,258 | |
| Closed | Cormier Quinn Christopher | $373,000 | |
| Closed | Cormier Quinn Christopher | $389,055 | |
| Previous Owner | Cormier Quinn Christopher | $410,000 | |
| Previous Owner | Evanoff Kimberly C | $125,000 | |
| Previous Owner | Evanoff Kimberly C | $417,000 |
Source: Public Records
Tax History Compared to Growth
Tax History
| Year | Tax Paid | Tax Assessment Tax Assessment Total Assessment is a certain percentage of the fair market value that is determined by local assessors to be the total taxable value of land and additions on the property. | Land | Improvement |
|---|---|---|---|---|
| 2023 | $10,495 | $735,500 | $402,600 | $332,900 |
| 2022 | $9,897 | $733,500 | $400,600 | $332,900 |
| 2021 | $9,545 | $695,500 | $348,400 | $347,100 |
| 2020 | $9,676 | $679,600 | $331,900 | $347,700 |
| 2019 | $9,210 | $663,800 | $316,100 | $347,700 |
| 2018 | $9,136 | $617,200 | $301,100 | $316,100 |
| 2017 | $8,566 | $578,400 | $238,100 | $340,300 |
| 2016 | $8,311 | $546,600 | $225,100 | $321,500 |
| 2015 | $7,029 | $456,900 | $210,400 | $246,500 |
| 2014 | -- | $454,700 | $199,500 | $255,200 |
Source: Public Records
Map
Nearby Homes
- 4404 Sunnyside Rd
- 4378 Browndale Ave
- 4128 W 45th St
- 4512 Moorland Ave
- 4401 Littel St
- 4387 Brook Ave S
- 4236 Salem Ave
- 4602 Edina Blvd
- 4304 Brook Ave S
- 4606 Drexel Ave
- 4507 Arden Ave
- 4801 E Sunnyslope Rd
- 4212 Princeton Ave
- 4370 Mackey Ave
- 4624 Bruce Ave
- 4304 W 42nd St
- 4630 Drexel Ave
- 4113 Monterey Ave
- 5521 W 42nd St
- 4812 Maple Rd
- 4383 Dart Ave
- 4383 Dart Ave
- 4379 Dart Ave
- 4324 W 44th St
- 4320 W 44th St
- 4375 Dart Ave
- 4380 Wooddale Ave
- 4370 Wooddale Ave
- 4382 Wooddale Ave
- 4371 Dart Ave
- 4360 Wooddale Ave
- 4400 W 44th St
- 4324 4324 44th-Street-w
- 4320 4320 W 44th St
- 4382 Dart Ave
- 4378 Dart Ave
- 4354 Wooddale Ave
- 4374 Dart Ave
- 4367 Dart Ave
- 4412 W 44th St