Estimated Value: $562,000 - $1,023,000
2
Beds
2
Baths
1,572
Sq Ft
$457/Sq Ft
Est. Value
About This Home
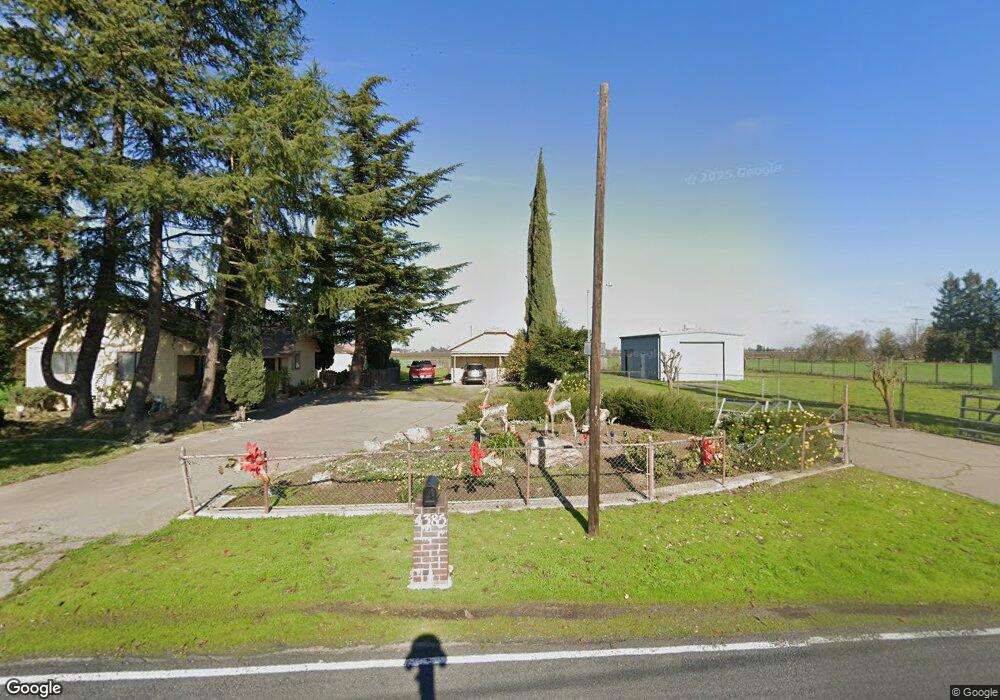
This home is located at 4385 W Kingdon Rd, Lodi, CA 95242 and is currently estimated at $717,924, approximately $456 per square foot. 4385 W Kingdon Rd is a home located in San Joaquin County with nearby schools including Ellerth E. Larson Elementary School, Lodi Middle School, and Tokay High School.
Ownership History
Date
Name
Owned For
Owner Type
Purchase Details
Closed on
Oct 30, 2018
Sold by
Hamm Patricia A
Bought by
Hamm Jack A and Hamm Patricia A
Current Estimated Value
Purchase Details
Closed on
Oct 30, 1998
Sold by
Griese Duane E
Bought by
Lima Helen M and Hamm Patricia A
Home Financials for this Owner
Home Financials are based on the most recent Mortgage that was taken out on this home.
Original Mortgage
$125,000
Outstanding Balance
$27,165
Interest Rate
6.54%
Mortgage Type
Seller Take Back
Estimated Equity
$690,759
Purchase Details
Closed on
Jul 5, 1994
Sold by
Griese Duane E
Bought by
Griese Duane E
Home Financials for this Owner
Home Financials are based on the most recent Mortgage that was taken out on this home.
Original Mortgage
$119,000
Interest Rate
6.87%
Create a Home Valuation Report for This Property
The Home Valuation Report is an in-depth analysis detailing your home's value as well as a comparison with similar homes in the area
Purchase History
| Date | Buyer | Sale Price | Title Company |
|---|---|---|---|
| Hamm Jack A | -- | None Available | |
| Lima Helen M | $225,000 | Chicago Title Co | |
| Griese Duane E | -- | North American Title |
Source: Public Records
Mortgage History
| Date | Status | Borrower | Loan Amount |
|---|---|---|---|
| Open | Lima Helen M | $125,000 | |
| Previous Owner | Griese Duane E | $119,000 |
Source: Public Records
Tax History
| Year | Tax Paid | Tax Assessment Tax Assessment Total Assessment is a certain percentage of the fair market value that is determined by local assessors to be the total taxable value of land and additions on the property. | Land | Improvement |
|---|---|---|---|---|
| 2025 | $4,376 | $374,663 | $195,953 | $178,710 |
| 2024 | $4,264 | $367,317 | $192,111 | $175,206 |
| 2023 | $4,219 | $360,116 | $188,345 | $171,771 |
| 2022 | $4,131 | $353,055 | $184,652 | $168,403 |
| 2021 | $4,200 | $346,133 | $181,032 | $165,101 |
| 2020 | $3,821 | $342,585 | $179,176 | $163,409 |
| 2019 | $3,744 | $335,868 | $175,663 | $160,205 |
| 2018 | $3,692 | $329,283 | $172,219 | $157,064 |
| 2017 | $3,610 | $322,828 | $168,843 | $153,985 |
| 2016 | $3,385 | $316,498 | $165,533 | $150,965 |
| 2014 | $3,315 | $305,638 | $159,853 | $145,785 |
Source: Public Records
Map
Nearby Homes
- 14275 N Neeley Rd
- 23181 Devries Rd
- 3587 W Sargent Rd
- 4175 W Sargent Rd
- 2636 W Turner Rd
- 1647 Marigold Way
- 481 W Highway 12
- 931 W Sargent Rd
- 2911 Zinnia Way
- 1820 Van Ruiten Dr
- 2905 Zinnia Way
- 209 E Highway 12
- 2013 Van Ruiten Dr
- 2830 Mcintosh Dr
- 2826 Cameo St
- 291 E Highway 12
- Arbor Plan at Gateway - Wisteria Collection
- Terrace Plan at Gateway - Wisteria Collection
- Promenade II Plan at Gateway - Wisteria Collection
- Promenade Plan at Gateway - Wisteria Collection
- 4471 W Kingdon Rd
- 14200 N Ray Rd
- 4289 W Kingdon Rd
- 14250 N Ray Rd
- 4225 W Kingdon Rd
- 4205 W Kingdon Rd
- 14444 N Ray Rd
- 4040 W Kingdon Rd
- 3838 W Kingdon Rd
- 4895 W Kingdon Rd
- 14245 N Neeley Rd
- 13859 N Neeley Rd
- 13810 N Ray Rd
- 13833 N Neeley Rd
- 3724 W Kingdon Rd
- 3757 W Kingdon Rd
- 13721 N Neeley Rd
- 13846 N Neeley Rd
- 13833 Royal Rd
- 13555 N Neeley Rd