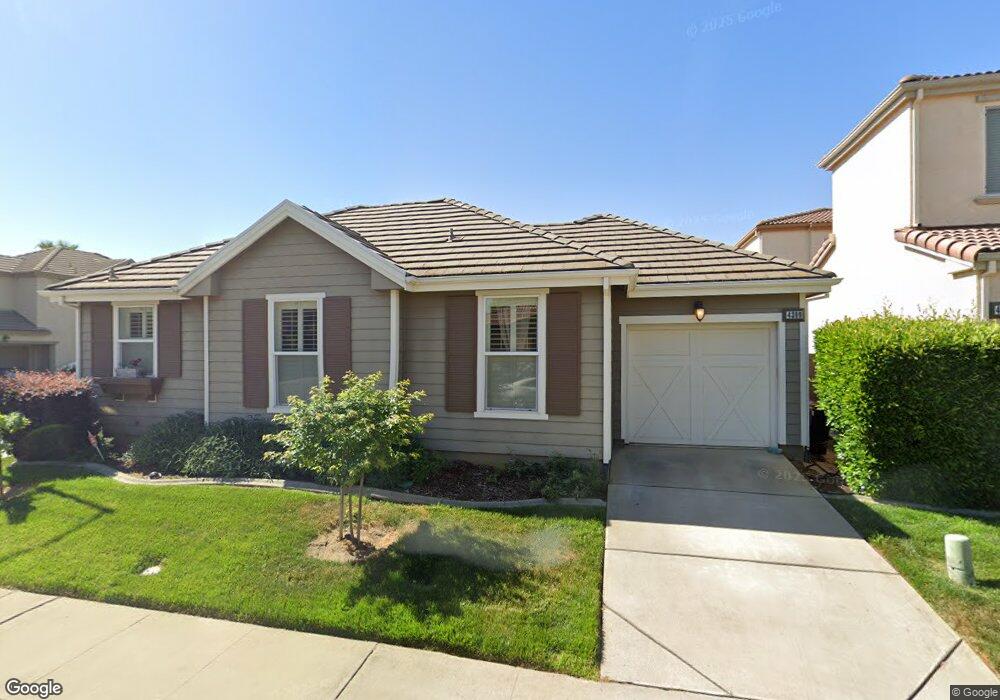
4399 Mount Ivy Way Rancho Cordova, CA 95742
Anatolia NeighborhoodEstimated Value: $305,000 - $469,000
3
Beds
2
Baths
1,000
Sq Ft
$403/Sq Ft
Est. Value
About This Home
This home is located at 4399 Mount Ivy Way, Rancho Cordova, CA 95742 and is currently estimated at $402,624, approximately $402 per square foot. 4399 Mount Ivy Way is a home located in Sacramento County with nearby schools including Robert J. McGarvey Elementary, Katherine L. Albiani Middle School, and Pleasant Grove High School.
Ownership History
Date
Name
Owned For
Owner Type
Purchase Details
Closed on
Apr 17, 2018
Sold by
Higgins Heather K and Higgins Beck Heather K
Bought by
Higgins Heather K
Current Estimated Value
Home Financials for this Owner
Home Financials are based on the most recent Mortgage that was taken out on this home.
Original Mortgage
$232,000
Outstanding Balance
$199,609
Interest Rate
4.46%
Mortgage Type
New Conventional
Estimated Equity
$203,015
Purchase Details
Closed on
Aug 11, 2006
Sold by
Beck Brian Wayne
Bought by
Higgins Beck Heather K
Home Financials for this Owner
Home Financials are based on the most recent Mortgage that was taken out on this home.
Original Mortgage
$239,950
Interest Rate
6.76%
Mortgage Type
Purchase Money Mortgage
Purchase Details
Closed on
Aug 10, 2006
Sold by
U S Home Corp
Bought by
Higgins Beck Heather K
Home Financials for this Owner
Home Financials are based on the most recent Mortgage that was taken out on this home.
Original Mortgage
$239,950
Interest Rate
6.76%
Mortgage Type
Purchase Money Mortgage
Create a Home Valuation Report for This Property
The Home Valuation Report is an in-depth analysis detailing your home's value as well as a comparison with similar homes in the area
Home Values in the Area
Average Home Value in this Area
Purchase History
| Date | Buyer | Sale Price | Title Company |
|---|---|---|---|
| Higgins Heather K | -- | Chicago Title Company | |
| Higgins Beck Heather K | -- | North American Title Co | |
| Higgins Beck Heather K | $300,000 | North American Title Co |
Source: Public Records
Mortgage History
| Date | Status | Borrower | Loan Amount |
|---|---|---|---|
| Open | Higgins Heather K | $232,000 | |
| Closed | Higgins Beck Heather K | $239,950 |
Source: Public Records
Tax History Compared to Growth
Tax History
| Year | Tax Paid | Tax Assessment Tax Assessment Total Assessment is a certain percentage of the fair market value that is determined by local assessors to be the total taxable value of land and additions on the property. | Land | Improvement |
|---|---|---|---|---|
| 2025 | $6,255 | $401,906 | $200,961 | $200,945 |
| 2024 | $6,255 | $394,026 | $197,021 | $197,005 |
| 2023 | $6,097 | $386,301 | $193,158 | $193,143 |
| 2022 | $5,963 | $378,727 | $189,371 | $189,356 |
| 2021 | $5,709 | $353,883 | $176,950 | $176,933 |
| 2020 | $5,175 | $307,725 | $153,870 | $153,855 |
| 2019 | $4,958 | $290,308 | $145,161 | $145,147 |
| 2018 | $4,693 | $279,143 | $139,578 | $139,565 |
| 2017 | $4,440 | $258,466 | $129,239 | $129,227 |
| 2016 | $4,234 | $243,837 | $121,924 | $121,913 |
| 2015 | $4,047 | $230,036 | $115,023 | $115,013 |
| 2014 | $3,905 | $219,082 | $109,546 | $109,536 |
Source: Public Records
Map
Nearby Homes
- 4403 Niobe Cir
- 4291 Sardonyx Way
- 4163 Aura Way
- 11794 Dionysus Way
- 11816 Spring Walk Way
- 11708 Azalea Garden Way
- 4253 Privas Way
- 4308 Hartland Way
- 4160 Anatolia Dr
- 4389 Kilroy Ct
- 12086 Mircado Way
- 11728 Dionysus Way
- 11708 Dionysus Way
- 11791 Battenburg Way
- 12042 Mircado Way
- 11790 Bagota Way
- Plan 3 at Montelena - Starblossom
- Plan 2 at Montelena - Starblossom
- Plan 1 at Montelena - Starblossom
- Plan 4 at Montelena - Starblossom
- 11819 Sophocles Dr
- 4395 Mount Ivy Way
- 11817 Sophocles Dr
- 4398 Mount Ivy Way
- 4394 Mount Kisco Way
- 4398 Mount Kisco Way
- 4391 Mount Ivy Way
- 4394 Mount Ivy Way
- 4390 Mount Kisco Way
- 11815 Sophocles Dr
- 11836 Windham Way
- 4390 Mount Ivy Way
- 11832 Windham Way
- 4386 Mount Kisco Way
- 4387 Mount Ivy Way
- 11811 Sophocles Dr
- 11828 Windham Way
- 11855 Golden Amber Ct
- 4386 Mount Ivy Way
- 11820 Sophocles Dr