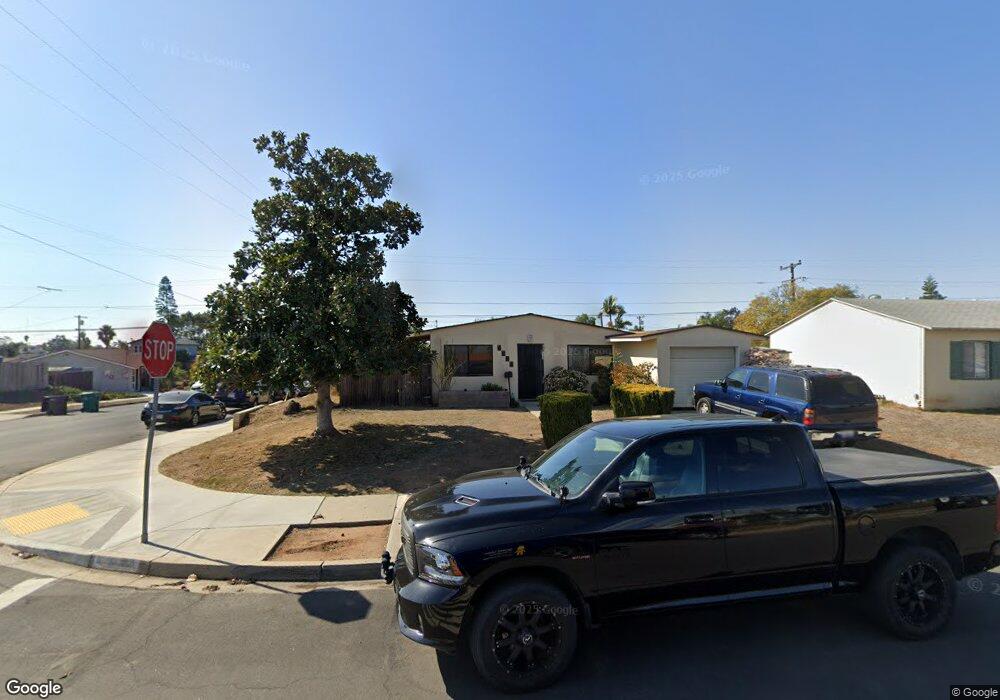
4404 Gila Ave San Diego, CA 92117
Bay Ho NeighborhoodEstimated Value: $864,000 - $1,030,000
3
Beds
1
Bath
888
Sq Ft
$1,055/Sq Ft
Est. Value
About This Home
This home is located at 4404 Gila Ave, San Diego, CA 92117 and is currently estimated at $936,632, approximately $1,054 per square foot. 4404 Gila Ave is a home located in San Diego County with nearby schools including Cadman Elementary School, Marston Middle School, and Clairemont High School.
Ownership History
Date
Name
Owned For
Owner Type
Purchase Details
Closed on
Nov 1, 2013
Sold by
Neal Natalie A O
Bought by
Neal Natalie A O
Current Estimated Value
Purchase Details
Closed on
Jul 19, 2013
Sold by
Neal Natalie A O
Bought by
Neal Natalie A O
Home Financials for this Owner
Home Financials are based on the most recent Mortgage that was taken out on this home.
Original Mortgage
$148,721
Outstanding Balance
$108,142
Interest Rate
3.92%
Mortgage Type
New Conventional
Estimated Equity
$828,490
Purchase Details
Closed on
Oct 22, 2001
Sold by
Oneal Natalie
Bought by
Oneal Natalie A
Purchase Details
Closed on
Jul 24, 2001
Sold by
Melena Robert
Bought by
Oneal Natalie
Home Financials for this Owner
Home Financials are based on the most recent Mortgage that was taken out on this home.
Original Mortgage
$184,000
Interest Rate
7.09%
Purchase Details
Closed on
Jul 29, 1994
Sold by
Melena Robert
Bought by
Melena Robert and The Robert Melena 1994 Trust
Purchase Details
Closed on
Mar 11, 1994
Sold by
Melena Robert and Melena Elva
Bought by
Melena Robert
Create a Home Valuation Report for This Property
The Home Valuation Report is an in-depth analysis detailing your home's value as well as a comparison with similar homes in the area
Home Values in the Area
Average Home Value in this Area
Purchase History
| Date | Buyer | Sale Price | Title Company |
|---|---|---|---|
| Neal Natalie A O | -- | None Available | |
| Neal Natalie A O | -- | Boston National Title | |
| Oneal Natalie A | -- | -- | |
| Oneal Natalie | $230,000 | Benefit Land Title Co | |
| Melena Robert | -- | -- | |
| Melena Robert | -- | -- |
Source: Public Records
Mortgage History
| Date | Status | Borrower | Loan Amount |
|---|---|---|---|
| Open | Neal Natalie A O | $148,721 | |
| Closed | Oneal Natalie | $184,000 |
Source: Public Records
Tax History Compared to Growth
Tax History
| Year | Tax Paid | Tax Assessment Tax Assessment Total Assessment is a certain percentage of the fair market value that is determined by local assessors to be the total taxable value of land and additions on the property. | Land | Improvement |
|---|---|---|---|---|
| 2025 | $4,126 | $339,758 | $192,038 | $147,720 |
| 2024 | $4,126 | $333,097 | $188,273 | $144,824 |
| 2023 | $4,034 | $326,567 | $184,582 | $141,985 |
| 2022 | $3,927 | $320,164 | $180,963 | $139,201 |
| 2021 | $3,901 | $313,887 | $177,415 | $136,472 |
| 2020 | $3,854 | $310,669 | $175,596 | $135,073 |
| 2019 | $3,785 | $304,578 | $172,153 | $132,425 |
| 2018 | $3,540 | $298,607 | $168,778 | $129,829 |
| 2017 | $3,456 | $292,753 | $165,469 | $127,284 |
| 2016 | $3,400 | $287,014 | $162,225 | $124,789 |
| 2015 | $3,350 | $282,704 | $159,789 | $122,915 |
| 2014 | -- | $277,167 | $156,659 | $120,508 |
Source: Public Records
Map
Nearby Homes
- 4182 Seri St
- 3701 Tavara Cir
- 4203 Tolowa St
- 3582 Hatteras Ave
- 4380 Rolfe Rd
- 4576 Onondaga Ave
- 4527 Kickapoo Ct
- 4150 Taos Dr
- 4587 Rolfe Rd
- 4543 Moraga Ave
- 4226 Mount Voss Dr
- 3476 Ogalala Ave
- 3129 Driscoll Dr
- 4135 Huerfano Ave
- 4472 Mount Lindsey Ave
- 4048 Raffee Dr
- 4010 Paducah Dr
- 4425 Caminito Pedernal
- 4527 Chinook Ct
- 4695 Mount Armet Dr
- 4410 Gila Ave
- 3710 Indian Way
- 4409 Pocahontas Ave
- 4416 Gila Ave
- 3781 Indian Way
- 4415 Pocahontas Ave
- 3711 Indian Way
- 3810 Indian Way
- 4409 Gila Ave
- 4422 Gila Ave
- 4384 Gila Ave
- 4415 Gila Ave
- 3811 Indian Way
- 4421 Pocahontas Ave
- 4389 Pocahontas Ave
- 4421 Gila Ave
- 4428 Gila Ave
- 3690 Indian Way
- 4383 Gila Ave
- 4376 Gila Ave