Estimated Value: $1,456,000 - $1,469,473
4
Beds
2
Baths
2,216
Sq Ft
$660/Sq Ft
Est. Value
About This Home
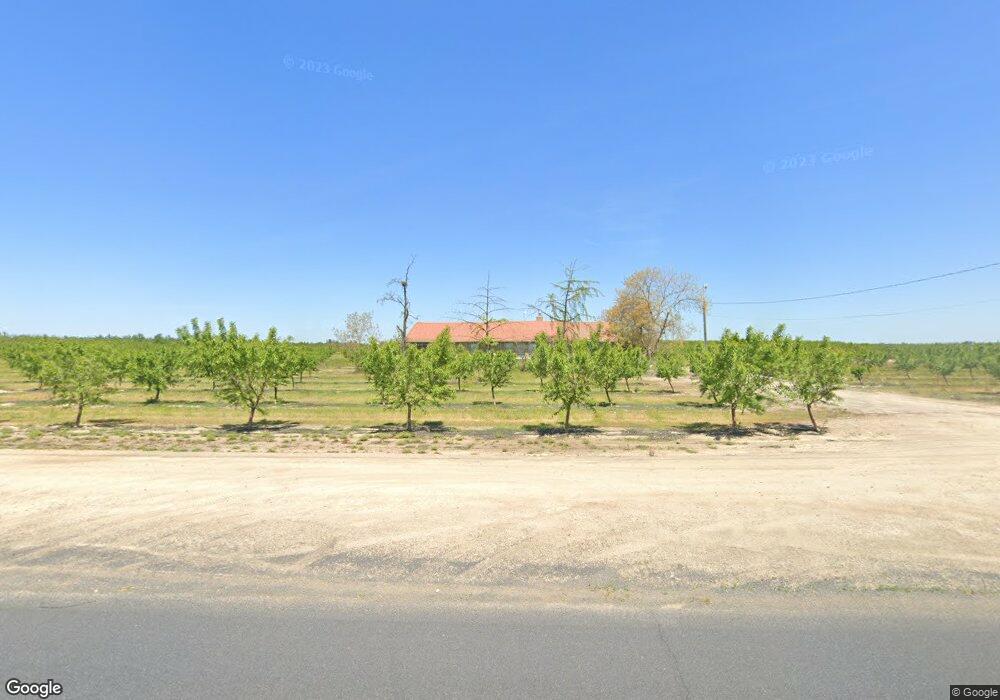
This home is located at 4407 Roeding Rd, Ceres, CA 95307 and is currently estimated at $1,462,737, approximately $660 per square foot. 4407 Roeding Rd is a home located in Stanislaus County with nearby schools including Hughson Elementary School, Fox Road Elementary School, and Emilie J. Ross Middle School.
Ownership History
Date
Name
Owned For
Owner Type
Purchase Details
Closed on
Mar 12, 2021
Sold by
Cotta Jacqueline A and R & J Cotta 2012 Trust
Bought by
Cotta Jacqueline A and R & J Cotta 2012 Trust Bypass
Current Estimated Value
Purchase Details
Closed on
Nov 6, 2012
Sold by
Cotta Richard L and Cotta Jacqueline A
Bought by
Cotta Richard L and Cotta Jacqueline A
Purchase Details
Closed on
Dec 21, 2011
Sold by
Gohring Roger E and Gohring Amy W
Bought by
Cotta Richard L and Cotta Jacqueline A
Home Financials for this Owner
Home Financials are based on the most recent Mortgage that was taken out on this home.
Original Mortgage
$660,000
Outstanding Balance
$449,965
Interest Rate
3.94%
Mortgage Type
Seller Take Back
Estimated Equity
$1,012,772
Purchase Details
Closed on
Oct 22, 2009
Sold by
Gohring Roger E and Gohring Amy W
Bought by
Gohring Roger E and Gohring Amy W
Create a Home Valuation Report for This Property
The Home Valuation Report is an in-depth analysis detailing your home's value as well as a comparison with similar homes in the area
Purchase History
| Date | Buyer | Sale Price | Title Company |
|---|---|---|---|
| Cotta Jacqueline A | -- | None Available | |
| Cotta Richard L | -- | None Available | |
| Cotta Richard L | -- | First American Title Company | |
| Gohring Roger E | -- | None Available |
Source: Public Records
Mortgage History
| Date | Status | Borrower | Loan Amount |
|---|---|---|---|
| Open | Cotta Richard L | $660,000 |
Source: Public Records
Tax History
| Year | Tax Paid | Tax Assessment Tax Assessment Total Assessment is a certain percentage of the fair market value that is determined by local assessors to be the total taxable value of land and additions on the property. | Land | Improvement |
|---|---|---|---|---|
| 2025 | $11,881 | $1,009,105 | $710,294 | $298,811 |
| 2024 | $11,452 | $1,017,355 | $696,367 | $320,988 |
| 2023 | $11,152 | $998,380 | $682,713 | $315,667 |
| 2022 | $11,053 | $978,447 | $669,327 | $309,120 |
| 2021 | $10,947 | $959,165 | $656,203 | $302,962 |
| 2020 | $10,617 | $950,024 | $649,475 | $300,549 |
| 2019 | $10,544 | $930,840 | $636,741 | $294,099 |
| 2018 | $10,317 | $912,896 | $624,256 | $288,640 |
| 2017 | $10,236 | $894,910 | $612,016 | $282,894 |
| 2016 | $10,029 | $877,371 | $600,016 | $277,355 |
| 2015 | $9,903 | $864,234 | $591,004 | $273,230 |
| 2014 | $9,578 | $836,443 | $566,266 | $270,177 |
Source: Public Records
Map
Nearby Homes
- 3724 Lockwood Rd
- 3613 Southern Oak Dr
- 3432 Vera Way
- 3408 Puma Way
- 3786 Waynesboro Dr
- 3524 Homestead Way Unit 57
- 3550 Mitchell Rd Unit 59
- 3010 Roeding Rd
- 3012 Donner Dr Unit 32
- 4837 Faith Home Rd Unit 162
- 4837 Faith Home Rd Unit 102
- 4837 Faith Home Rd Unit 4
- 4837 Faith Home Rd Unit 177
- 4837 Faith Home Rd Unit 136
- 4837 Faith Home Rd Unit 26
- 1813 Lupin Ln
- 3221 E Redwood Rd
- 3009 Glen Grove Ct
- 1536 Vandalay Dr
- 2708 Oasis Ave
- 4418 Roeding Rd Unit A
- 4418 Roeding Rd
- 4455 Roeding Rd
- 4454 Roeding Rd
- 4518 Roeding Rd
- 0 Lockwood Rd
- 3400 Lockwood Rd
- 3425 Lockwood Rd
- 3513 Lockwood Rd
- 3230 Lockwood Rd
- 3330 Lockwood Rd
- 3324 Lockwood Rd
- 3118 Lockwood Rd
- 3625 Lockwood Rd
- 3625 Lockwood Rd
- 3612 Lockwood Rd
- 4717 Roeding Rd
- 4718 Roeding Rd
- 3048 Faith Home Rd
- 4730 Roeding Rd
Your Personal Tour Guide
Ask me questions while you tour the home.