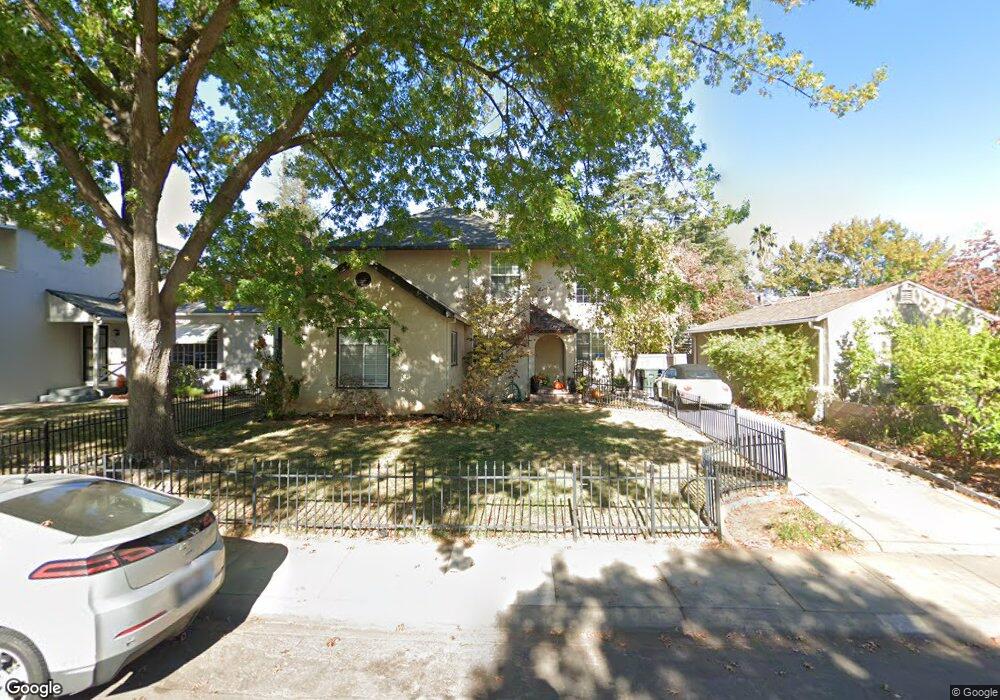
442 Pico Way Sacramento, CA 95819
East Sacramento NeighborhoodEstimated Value: $578,000 - $987,000
3
Beds
2
Baths
2,161
Sq Ft
$390/Sq Ft
Est. Value
About This Home
This home is located at 442 Pico Way, Sacramento, CA 95819 and is currently estimated at $843,535, approximately $390 per square foot. 442 Pico Way is a home located in Sacramento County with nearby schools including Caleb Greenwood Elementary, Miwok Middle School, and Hiram W. Johnson High School.
Ownership History
Date
Name
Owned For
Owner Type
Purchase Details
Closed on
Jul 10, 2007
Sold by
Holloway Brian F and Holloway Lisa G
Bought by
Holloway Brian F and Holloway Lisa G
Current Estimated Value
Purchase Details
Closed on
Nov 4, 2003
Sold by
Holloway Brian F and Holloway Lisa
Bought by
Holloway Brian F and Holloway Lisa G
Purchase Details
Closed on
Dec 24, 1997
Sold by
Holloway Brian F
Bought by
Holloway Brian F and Holloway Lisa
Home Financials for this Owner
Home Financials are based on the most recent Mortgage that was taken out on this home.
Original Mortgage
$210,000
Outstanding Balance
$35,496
Interest Rate
7.22%
Mortgage Type
Construction
Estimated Equity
$808,039
Purchase Details
Closed on
Mar 28, 1994
Sold by
Boelen Kenneth R and Boelen Barbara W
Bought by
Holloway Brian F
Home Financials for this Owner
Home Financials are based on the most recent Mortgage that was taken out on this home.
Original Mortgage
$142,125
Interest Rate
7.15%
Create a Home Valuation Report for This Property
The Home Valuation Report is an in-depth analysis detailing your home's value as well as a comparison with similar homes in the area
Home Values in the Area
Average Home Value in this Area
Purchase History
| Date | Buyer | Sale Price | Title Company |
|---|---|---|---|
| Holloway Brian F | -- | None Available | |
| Holloway Brian F | -- | -- | |
| Holloway Brian F | -- | Golden California Title Co | |
| Holloway Brian F | $189,500 | Placer Title Company |
Source: Public Records
Mortgage History
| Date | Status | Borrower | Loan Amount |
|---|---|---|---|
| Open | Holloway Brian F | $210,000 | |
| Closed | Holloway Brian F | $142,125 |
Source: Public Records
Tax History Compared to Growth
Tax History
| Year | Tax Paid | Tax Assessment Tax Assessment Total Assessment is a certain percentage of the fair market value that is determined by local assessors to be the total taxable value of land and additions on the property. | Land | Improvement |
|---|---|---|---|---|
| 2025 | $4,383 | $372,226 | $127,459 | $244,767 |
| 2024 | $4,383 | $364,928 | $124,960 | $239,968 |
| 2023 | $4,279 | $357,773 | $122,510 | $235,263 |
| 2022 | $4,205 | $350,758 | $120,108 | $230,650 |
| 2021 | $4,007 | $343,881 | $117,753 | $226,128 |
| 2020 | $4,038 | $340,356 | $116,546 | $223,810 |
| 2019 | $3,952 | $333,683 | $114,261 | $219,422 |
| 2018 | $3,848 | $327,141 | $112,021 | $215,120 |
| 2017 | $3,794 | $320,727 | $109,825 | $210,902 |
| 2016 | $3,703 | $314,439 | $107,672 | $206,767 |
| 2015 | $3,635 | $309,717 | $106,055 | $203,662 |
| 2014 | $3,536 | $303,651 | $103,978 | $199,673 |
Source: Public Records
Map
Nearby Homes