4420 Walali Way Fair Oaks, CA 95628
Estimated Value: $594,000 - $728,000
4
Beds
3
Baths
3,062
Sq Ft
$219/Sq Ft
Est. Value
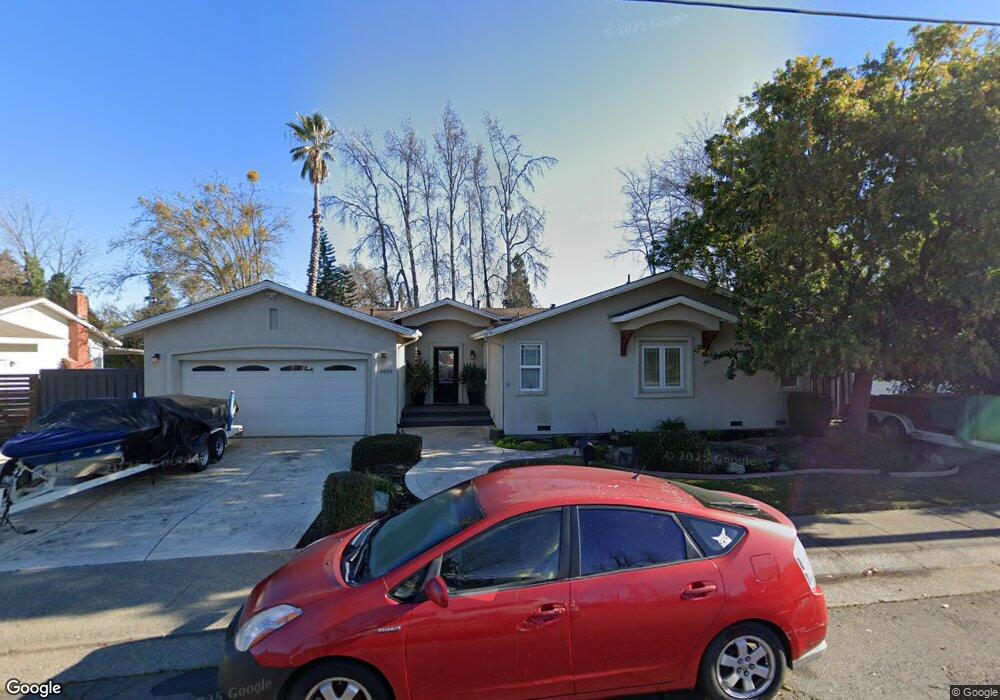
About This Home
This home is located at 4420 Walali Way, Fair Oaks, CA 95628 and is currently estimated at $671,216, approximately $219 per square foot. 4420 Walali Way is a home located in Sacramento County with nearby schools including Twin Lakes Elementary School, Andrew Carnegie Middle School, and Bella Vista High School.
Ownership History
Date
Name
Owned For
Owner Type
Purchase Details
Closed on
Oct 24, 2005
Sold by
Shelley Mieka M and Shelley Mark E
Bought by
Shelley Mark E and Shelley Mieka M
Current Estimated Value
Home Financials for this Owner
Home Financials are based on the most recent Mortgage that was taken out on this home.
Original Mortgage
$359,650
Outstanding Balance
$191,530
Interest Rate
5.68%
Mortgage Type
New Conventional
Estimated Equity
$479,686
Purchase Details
Closed on
Aug 12, 2004
Sold by
Fuhrmann Ralph J and Fuhrmann Margaret E
Bought by
Shelley Mark E and Shelley Meika M
Home Financials for this Owner
Home Financials are based on the most recent Mortgage that was taken out on this home.
Original Mortgage
$292,000
Interest Rate
5.97%
Mortgage Type
Purchase Money Mortgage
Purchase Details
Closed on
Sep 23, 1993
Sold by
Coulombe John H and Coulombe Beatrice J
Bought by
Fuhrmann Ralph J and Fuhrmann Margaret E
Create a Home Valuation Report for This Property
The Home Valuation Report is an in-depth analysis detailing your home's value as well as a comparison with similar homes in the area
Home Values in the Area
Average Home Value in this Area
Purchase History
| Date | Buyer | Sale Price | Title Company |
|---|---|---|---|
| Shelley Mark E | -- | Financial Title Company | |
| Shelley Mark E | $365,000 | Placer Title Company | |
| Fuhrmann Ralph J | $139,500 | Fidelity National Title |
Source: Public Records
Mortgage History
| Date | Status | Borrower | Loan Amount |
|---|---|---|---|
| Open | Shelley Mark E | $359,650 | |
| Closed | Shelley Mark E | $292,000 |
Source: Public Records
Tax History Compared to Growth
Tax History
| Year | Tax Paid | Tax Assessment Tax Assessment Total Assessment is a certain percentage of the fair market value that is determined by local assessors to be the total taxable value of land and additions on the property. | Land | Improvement |
|---|---|---|---|---|
| 2025 | $7,550 | $521,150 | $132,414 | $388,736 |
| 2024 | $7,550 | $510,932 | $129,818 | $381,114 |
| 2023 | $6,020 | $500,915 | $127,273 | $373,642 |
| 2022 | $5,996 | $491,094 | $124,778 | $366,316 |
| 2021 | $5,879 | $481,466 | $122,332 | $359,134 |
| 2020 | $5,392 | $443,628 | $118,829 | $324,799 |
| 2019 | $5,177 | $428,627 | $114,811 | $313,816 |
| 2018 | $4,916 | $408,217 | $109,344 | $298,873 |
| 2017 | $4,636 | $381,512 | $102,191 | $279,321 |
| 2016 | $4,126 | $356,554 | $95,506 | $261,048 |
| 2015 | $3,957 | $342,841 | $91,833 | $251,008 |
| 2014 | $3,872 | $336,118 | $90,032 | $246,086 |
Source: Public Records
Map
Nearby Homes
- 4344 Walali Way
- 8909 La Serena Dr
- 4144 Quiet Meadow Ct
- 8890 N Winding Way
- 4217 Curragh Oaks Ln
- 8808 Chandeaux Ln
- 8830 Barrister Ln
- 4117 Thistledown Dr
- 8879 Sunset Ave
- 8739 Noland Ln
- 9085 Hangar Way
- 8911 Bluff Ln
- 8888 Bluff Ln
- 4820 Sanford St
- 0 Illinois Ave Unit 225121990
- 4257 Winding Woods Way
- 9065 Approach Ct
- 8909 Ramstad Ave
- 8954 Phoenix Ave
- 8801 Villa Campo Way
- 4428 Walali Way
- 4412 Walali Way
- 4524 Wawona Cir
- 4516 Wawona Cir
- 4436 Walali Way
- 4534 Wawona Cir
- 4406 Walali Way
- 4413 Durango Ct
- 4508 Wawona Cir
- 4435 Walali Way
- 4425 Durango Ct
- 4502 Las Encinitas Dr
- 4415 Durango Ct
- 4536 Wawona Cir
- 4400 Walali Way
- 4525 Wawona Cir
- 4500 Wawona Cir
- 4454 Las Encinitas Dr
- 4517 Wawona Cir
- 4364 Morelia Ct