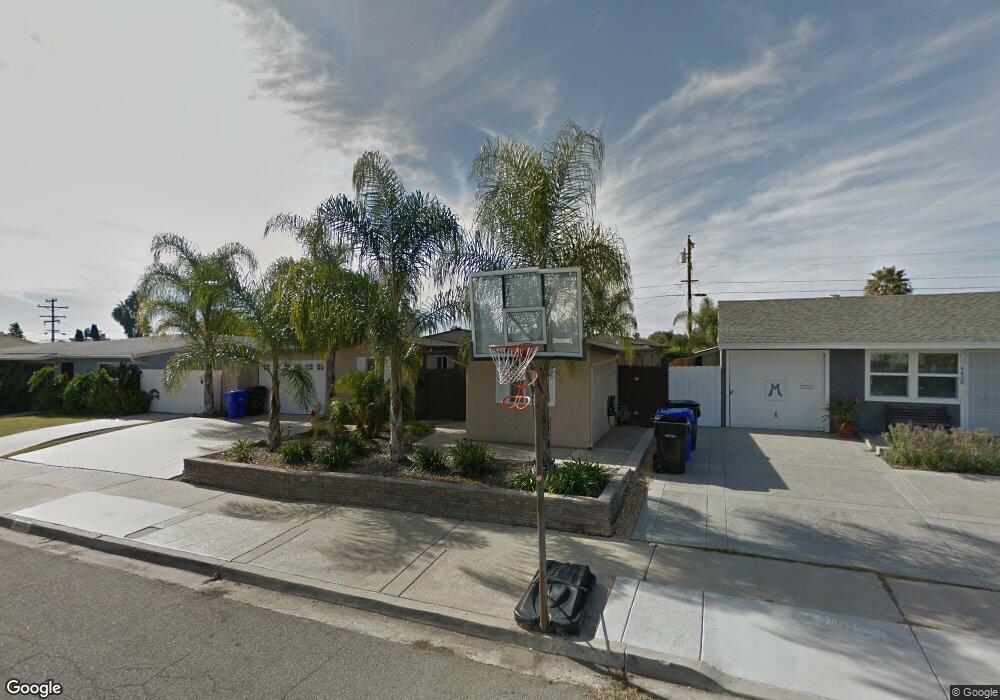
4422 Gila Ave San Diego, CA 92117
Bay Ho NeighborhoodEstimated Value: $1,152,000 - $1,240,000
3
Beds
2
Baths
1,635
Sq Ft
$734/Sq Ft
Est. Value
About This Home
This home is located at 4422 Gila Ave, San Diego, CA 92117 and is currently estimated at $1,199,326, approximately $733 per square foot. 4422 Gila Ave is a home located in San Diego County with nearby schools including Cadman Elementary School, Marston Middle School, and Clairemont High School.
Ownership History
Date
Name
Owned For
Owner Type
Purchase Details
Closed on
Jun 14, 2011
Sold by
Dowd Christopher and Dowd Christianne
Bought by
Lowe Jennifer P and Hamm Nancy
Current Estimated Value
Home Financials for this Owner
Home Financials are based on the most recent Mortgage that was taken out on this home.
Original Mortgage
$342,750
Outstanding Balance
$234,838
Interest Rate
4.5%
Mortgage Type
New Conventional
Estimated Equity
$964,488
Purchase Details
Closed on
Oct 15, 2007
Sold by
Longfellow Joseph A
Bought by
Dowd Christopher and Dowd Christianne
Home Financials for this Owner
Home Financials are based on the most recent Mortgage that was taken out on this home.
Original Mortgage
$25,000
Interest Rate
6.38%
Mortgage Type
Unknown
Purchase Details
Closed on
Jun 13, 2007
Sold by
Longfellow Gary N
Bought by
Gary N Longfellow Trust
Create a Home Valuation Report for This Property
The Home Valuation Report is an in-depth analysis detailing your home's value as well as a comparison with similar homes in the area
Home Values in the Area
Average Home Value in this Area
Purchase History
| Date | Buyer | Sale Price | Title Company |
|---|---|---|---|
| Lowe Jennifer P | $457,000 | Lawyers Title | |
| Dowd Christopher | $269,000 | Chicago Title Company | |
| Gary N Longfellow Trust | -- | None Available |
Source: Public Records
Mortgage History
| Date | Status | Borrower | Loan Amount |
|---|---|---|---|
| Open | Lowe Jennifer P | $342,750 | |
| Previous Owner | Dowd Christopher | $25,000 | |
| Previous Owner | Dowd Christopher | $215,000 |
Source: Public Records
Tax History Compared to Growth
Tax History
| Year | Tax Paid | Tax Assessment Tax Assessment Total Assessment is a certain percentage of the fair market value that is determined by local assessors to be the total taxable value of land and additions on the property. | Land | Improvement |
|---|---|---|---|---|
| 2025 | $7,142 | $597,402 | $414,491 | $182,911 |
| 2024 | $7,142 | $585,689 | $406,364 | $179,325 |
| 2023 | $6,982 | $574,206 | $398,397 | $175,809 |
| 2022 | $6,795 | $562,948 | $390,586 | $172,362 |
| 2021 | $6,747 | $551,911 | $382,928 | $168,983 |
| 2020 | $6,665 | $546,253 | $379,002 | $167,251 |
| 2019 | $6,544 | $535,543 | $371,571 | $163,972 |
| 2018 | $6,117 | $525,043 | $364,286 | $160,757 |
| 2017 | $81 | $514,749 | $357,144 | $157,605 |
| 2016 | $5,874 | $504,657 | $350,142 | $154,515 |
| 2015 | $5,786 | $497,078 | $344,883 | $152,195 |
| 2014 | $5,694 | $487,342 | $338,128 | $149,214 |
Source: Public Records
Map
Nearby Homes
- 3701 Tavara Cir
- 4182 Seri St
- 4203 Tolowa St
- 3582 Hatteras Ave
- 3571 Idlewild Way
- 4576 Onondaga Ave
- 4380 Rolfe Rd
- 4527 Kickapoo Ct
- 4150 Taos Dr
- 4543 Moraga Ave
- 3294 Atari Ct
- 3129 Driscoll Dr
- 3476 Ogalala Ave
- 4226 Mount Voss Dr
- 4135 Huerfano Ave
- 4048 Raffee Dr
- 4425 Caminito Pedernal
- 4472 Mount Lindsey Ave
- 4527 Chinook Ct
- 4060 Huerfano Ave Unit 143
- 4416 Gila Ave
- 4428 Gila Ave
- 4421 Pocahontas Ave
- 4427 Pocahontas Ave
- 4415 Pocahontas Ave
- 4410 Gila Ave
- 4434 Gila Ave
- 4433 Pocahontas Ave Unit B
- 4433 Pocahontas Ave
- 4409 Pocahontas Ave
- 4421 Gila Ave
- 4427 Gila Ave
- 4415 Gila Ave
- 4404 Gila Ave
- 4440 Gila Ave
- 4433 Gila Ave
- 4409 Gila Ave
- 4439 Pocahontas Ave
- 3710 Indian Way
- 4439 Gila Ave