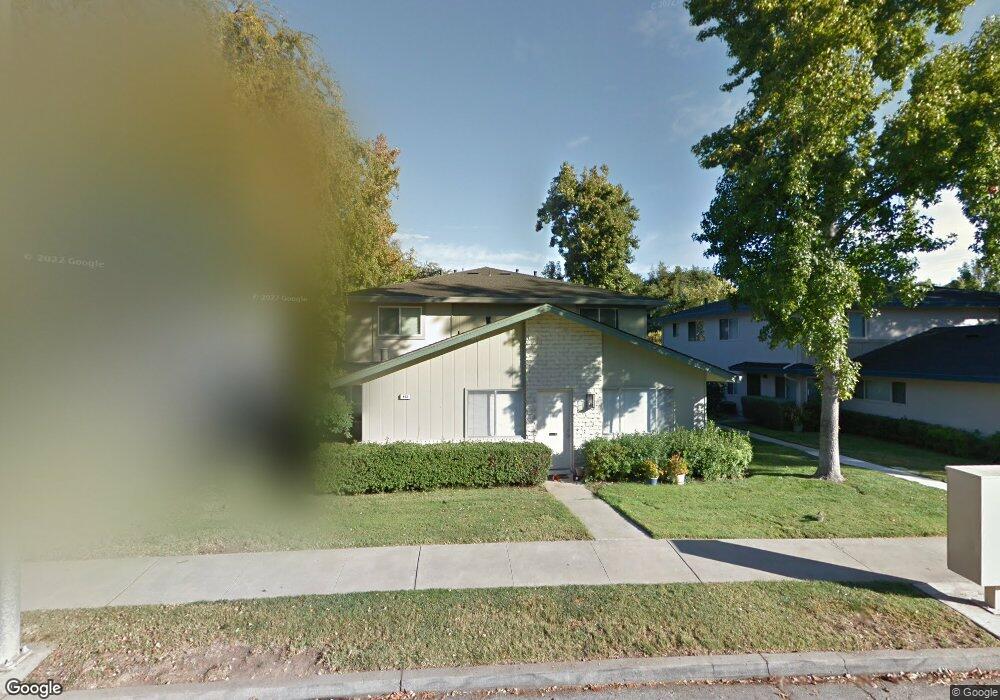
443 E Latimer Ave Unit 1 Campbell, CA 95008
Downtown Campbell NeighborhoodEstimated Value: $623,338 - $772,000
2
Beds
1
Bath
810
Sq Ft
$840/Sq Ft
Est. Value
About This Home
This home is located at 443 E Latimer Ave Unit 1, Campbell, CA 95008 and is currently estimated at $680,585, approximately $840 per square foot. 443 E Latimer Ave Unit 1 is a home located in Santa Clara County with nearby schools including Rosemary Elementary School, Del Mar High School, and Campbell School of Innovation.
Ownership History
Date
Name
Owned For
Owner Type
Purchase Details
Closed on
Nov 19, 2020
Sold by
Ronald Shannon L
Bought by
Ronald Richard R and Ronald Shannon L
Current Estimated Value
Purchase Details
Closed on
Aug 24, 2017
Sold by
Smith Kevin V
Bought by
Smith Kevin V and Smith Cynthia E
Purchase Details
Closed on
Feb 18, 2010
Sold by
Ronald Shannon and Smith Kevin
Bought by
Ronald Shannon L and Smith Kevin
Purchase Details
Closed on
Aug 9, 2006
Sold by
Smith Sandra Lee
Bought by
Smith Sandra Lee
Purchase Details
Closed on
Nov 12, 1993
Sold by
Marais Laurence
Bought by
Smith Sandra Lee
Home Financials for this Owner
Home Financials are based on the most recent Mortgage that was taken out on this home.
Original Mortgage
$70,100
Interest Rate
6.88%
Create a Home Valuation Report for This Property
The Home Valuation Report is an in-depth analysis detailing your home's value as well as a comparison with similar homes in the area
Home Values in the Area
Average Home Value in this Area
Purchase History
| Date | Buyer | Sale Price | Title Company |
|---|---|---|---|
| Ronald Richard R | -- | None Available | |
| Smith Kevin V | -- | None Available | |
| Ronald Shannon L | -- | None Available | |
| Smith Sandra Lee | -- | None Available | |
| Smith Sandra Lee | -- | First American Title Guarant |
Source: Public Records
Mortgage History
| Date | Status | Borrower | Loan Amount |
|---|---|---|---|
| Closed | Smith Sandra Lee | $70,100 |
Source: Public Records
Tax History
| Year | Tax Paid | Tax Assessment Tax Assessment Total Assessment is a certain percentage of the fair market value that is determined by local assessors to be the total taxable value of land and additions on the property. | Land | Improvement |
|---|---|---|---|---|
| 2025 | $3,012 | $175,954 | $70,416 | $105,538 |
| 2024 | $3,012 | $172,505 | $69,036 | $103,469 |
| 2023 | $2,981 | $169,124 | $67,683 | $101,441 |
| 2022 | $3,022 | $165,808 | $66,356 | $99,452 |
| 2021 | $2,950 | $162,557 | $65,055 | $97,502 |
| 2020 | $2,862 | $160,891 | $64,388 | $96,503 |
| 2019 | $2,807 | $157,737 | $63,126 | $94,611 |
| 2018 | $2,715 | $154,645 | $61,889 | $92,756 |
| 2017 | $2,661 | $151,614 | $60,676 | $90,938 |
| 2016 | $2,496 | $148,642 | $59,487 | $89,155 |
| 2015 | $2,430 | $146,410 | $58,594 | $87,816 |
| 2014 | $2,275 | $143,543 | $57,447 | $86,096 |
Source: Public Records
Map
Nearby Homes
- 331 N 1st St Unit 3
- 68 Page St
- 722 Duncanville Ct
- 160 Quail Hollow Dr Unit 160A
- 87 Salice Way
- 206 Sunnyside Ave
- 185 Union Ave Unit 40
- 50 Union Ave
- 143 Kennedy Ave
- 56 Sunnyside Ave
- 44 Sunnyside Ave
- 63 Braxton Terrace
- 186 W Rincon Ave
- 26 Quail Hollow Dr Unit 26
- 919 Ravenscourt Ave
- 425 Queens Ct
- 21 Quail Hollow Dr Unit 21
- 848 Apricot Ave Unit B
- 102 Quail Hollow Dr Unit 102
- 273 Llewellyn Ave Unit 10-18 Plan 2
- 443 E Latimer Ave Unit 4
- 443 E Latimer Ave Unit 3
- 443 E Latimer Ave Unit 2
- 463 E Latimer Ave Unit 4
- 463 E Latimer Ave Unit 3
- 463 E Latimer Ave Unit 2
- 463 E Latimer Ave Unit 1
- 423 E Latimer Ave Unit 4
- 423 E Latimer Ave Unit 3
- 423 E Latimer Ave Unit 2
- 423 E Latimer Ave Unit 1
- 300 N 1st St Unit 4
- 300 N 1st St Unit 3
- 300 N 1st St Unit 2
- 300 N 1st St Unit 1
- 236 N 1st St
- 261 N Central Ave
- 310 N 1st St Unit 4
- 310 N 1st St Unit 3
- 310 N 1st St Unit 2
Your Personal Tour Guide
Ask me questions while you tour the home.