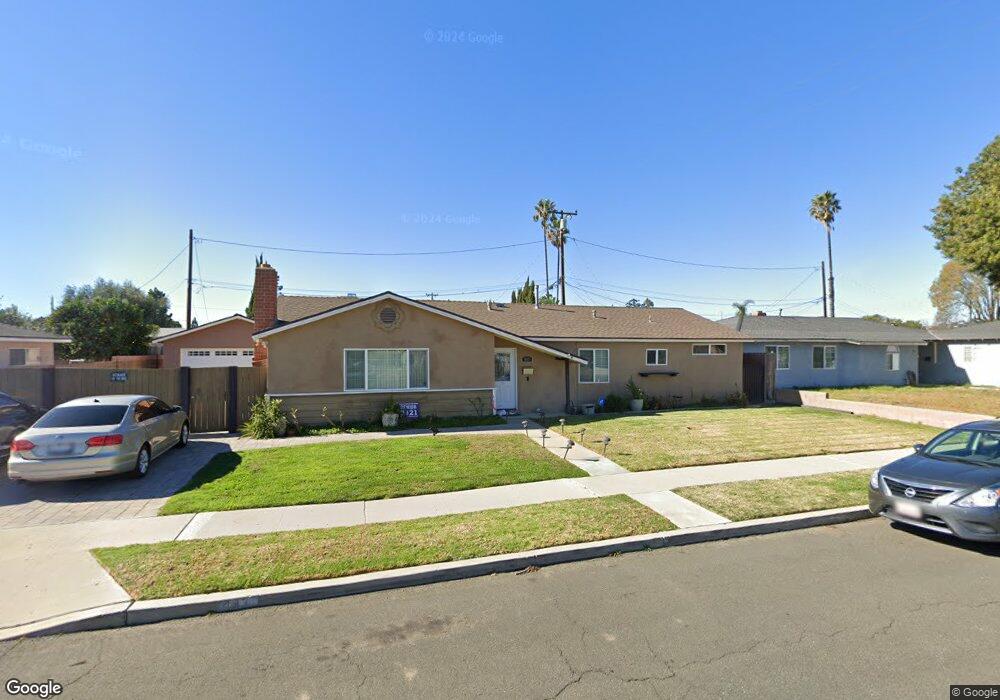
443 Staunton St Camarillo, CA 93010
Estimated Value: $800,000 - $1,002,000
3
Beds
2
Baths
1,763
Sq Ft
$500/Sq Ft
Est. Value
About This Home
This home is located at 443 Staunton St, Camarillo, CA 93010 and is currently estimated at $881,335, approximately $499 per square foot. 443 Staunton St is a home located in Ventura County with nearby schools including Dos Caminos Elementary School, Las Colinas Middle School, and Adolfo Camarillo High School.
Ownership History
Date
Name
Owned For
Owner Type
Purchase Details
Closed on
Jun 5, 2014
Sold by
Whetstone David and Whetstone Linda
Bought by
Hurtado Xochiti
Current Estimated Value
Home Financials for this Owner
Home Financials are based on the most recent Mortgage that was taken out on this home.
Original Mortgage
$350,000
Outstanding Balance
$265,917
Interest Rate
4.17%
Mortgage Type
New Conventional
Estimated Equity
$615,418
Purchase Details
Closed on
Jun 8, 2012
Sold by
Lord Brian
Bought by
Whetstone David and Whetstone Linda
Purchase Details
Closed on
Jan 12, 2009
Sold by
Whetstone David and Whetstone Linda
Bought by
Lord Brian
Home Financials for this Owner
Home Financials are based on the most recent Mortgage that was taken out on this home.
Original Mortgage
$407,500
Interest Rate
5.14%
Mortgage Type
Seller Take Back
Create a Home Valuation Report for This Property
The Home Valuation Report is an in-depth analysis detailing your home's value as well as a comparison with similar homes in the area
Home Values in the Area
Average Home Value in this Area
Purchase History
| Date | Buyer | Sale Price | Title Company |
|---|---|---|---|
| Hurtado Xochiti | $455,000 | Lawyers Title | |
| Whetstone David | $410,000 | None Available | |
| Lord Brian | $177,500 | Chicago Title Company |
Source: Public Records
Mortgage History
| Date | Status | Borrower | Loan Amount |
|---|---|---|---|
| Open | Hurtado Xochiti | $350,000 | |
| Previous Owner | Lord Brian | $407,500 |
Source: Public Records
Tax History Compared to Growth
Tax History
| Year | Tax Paid | Tax Assessment Tax Assessment Total Assessment is a certain percentage of the fair market value that is determined by local assessors to be the total taxable value of land and additions on the property. | Land | Improvement |
|---|---|---|---|---|
| 2025 | $5,999 | $551,625 | $358,560 | $193,065 |
| 2024 | $5,999 | $540,809 | $351,529 | $189,280 |
| 2023 | $5,783 | $530,205 | $344,636 | $185,569 |
| 2022 | $5,764 | $519,809 | $337,878 | $181,931 |
| 2021 | $5,556 | $509,617 | $331,253 | $178,364 |
| 2020 | $5,535 | $504,393 | $327,857 | $176,536 |
| 2019 | $5,509 | $494,504 | $321,429 | $173,075 |
| 2018 | $5,407 | $484,809 | $315,127 | $169,682 |
| 2017 | $5,087 | $475,304 | $308,949 | $166,355 |
| 2016 | $4,964 | $465,986 | $302,892 | $163,094 |
| 2015 | $4,911 | $458,990 | $298,344 | $160,646 |
| 2014 | $4,461 | $411,451 | $205,729 | $205,722 |
Source: Public Records
Map
Nearby Homes
- 478 Staunton St
- 2701 Barry St
- 591 Via Chelsea
- 876 Palmer Ave
- 120 Palm Dr
- 62 + Calleguas
- 744 Sharon Dr
- 865 Mobil Ave
- 167 Westpark Ct Unit 102
- 2174 Wilcox St
- 861 Dara St
- 1917 Colonia Place
- 302 Marlee Ln
- 391 Grandview Cir
- 741 Guy Turner Dr
- 755 Guy Turner Dr
- 745 Guy Turner Dr
- 747 Guy Turner Dr
- 1461 Lexington Ct
- 3343 Shadetree Way
- 451 Staunton St
- 433 Staunton St
- 2542 Obrien Cir
- 2550 Obrien Cir
- 2534 Obrien Cir
- 442 Staunton St
- 461 Staunton St
- 450 Staunton St
- 2560 Obrien Cir
- 2543 Obrien Cir
- 460 Staunton St
- 422 Staunton St
- 2551 Obrien Cir
- 477 Graham Ave
- 415 Staunton St
- 463 Graham Ave
- 2535 Obrien Cir
- 2511 Obrien Cir
- 491 Graham Ave
- 449 Graham Ave