
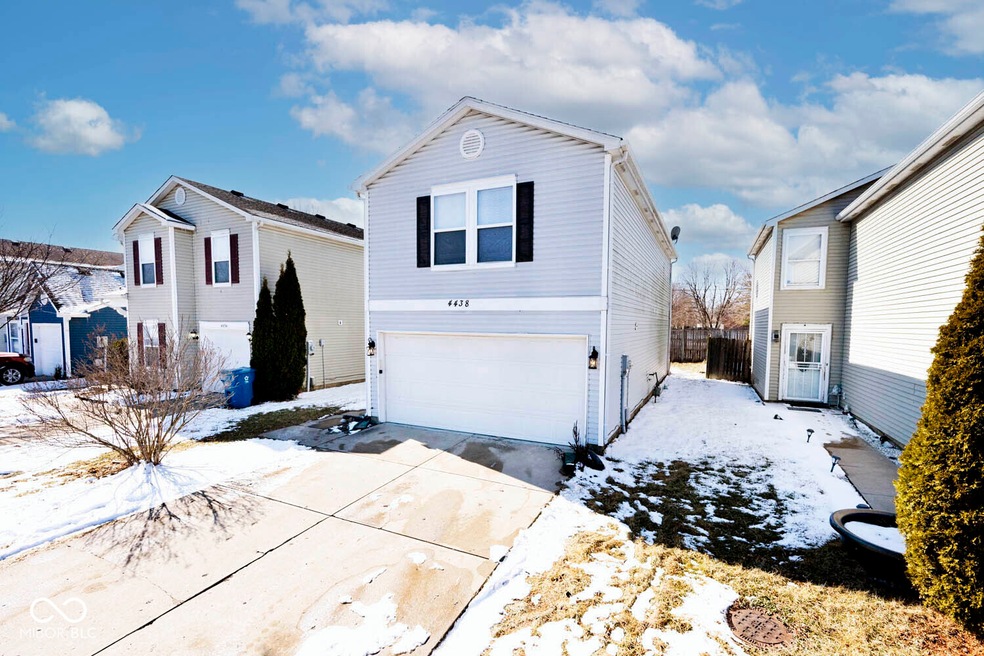
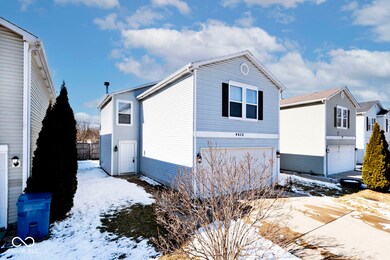

4438 Fullwood Ct Indianapolis, IN 46254
International Marketplace Neighborhood
3
Beds
2
Baths
1,368
Sq Ft
3,485
Sq Ft Lot
Highlights
- No HOA
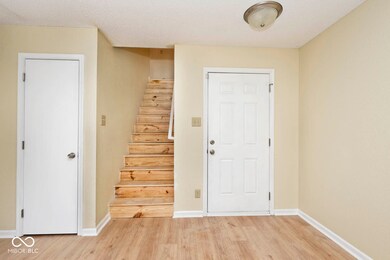
- Woodwork
- Family or Dining Combination
- 2 Car Attached Garage
- Forced Air Heating and Cooling System
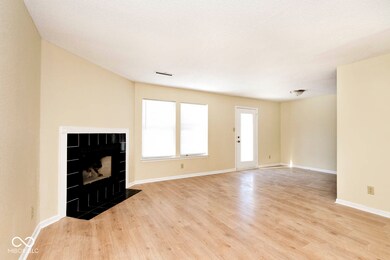
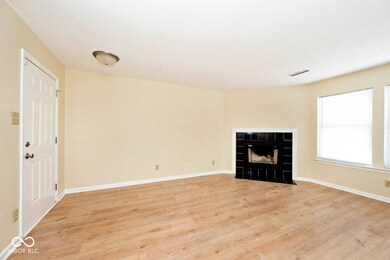
About This Home
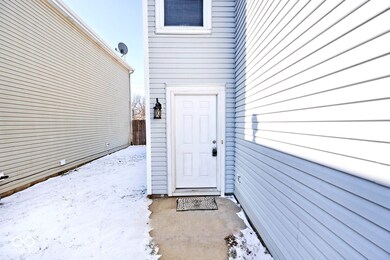
As of April 2025Schedule your showing today for this move-in ready two-level 3 bedroom, 2 bath recently updated home in Pike Township. Decorative fireplace in large open concept living area and fresh paint throughout home. Large fenced backyard. Primary suite features large garden tub and walk in closet. Full tub in additional full bathroom. Second floor laundry with washer and dryer included.
Last Agent to Sell the Property
F.C. Tucker Company License #RB14036454 Listed on: 02/28/2025
Home Details
Home Type
- Single Family
Est. Annual Taxes
- $1,462
Year Built
- Built in 1999 | Remodeled
Lot Details
- 3,485 Sq Ft Lot
Parking
- 2 Car Attached Garage
Home Design
- Slab Foundation
- Vinyl Siding
Interior Spaces
- 2-Story Property
- Woodwork
- Family Room with Fireplace
- Family or Dining Combination
Kitchen
- Electric Oven
- Built-In Microwave
- Dishwasher
Bedrooms and Bathrooms
- 3 Bedrooms
- 2 Full Bathrooms
Laundry
- Laundry on upper level
- Dryer
- Washer
Schools
- Pike High School
Utilities
- Forced Air Heating and Cooling System
- Electric Water Heater
Community Details
- No Home Owners Association
- Moller Village Subdivision
Listing and Financial Details
- Tax Lot 7
- Assessor Parcel Number 490513105001006674
- Seller Concessions Not Offered
Ownership History
Date
Name
Owned For
Owner Type
Purchase Details
Listed on
Feb 28, 2025
Closed on
Apr 2, 2025
Sold by
Dhaiti Carline
Bought by
Teng Diana and Pun Jacky
Seller's Agent
Stacie Kidwell Sandoval
F.C. Tucker Company
Buyer's Agent
Peter Stewart
Keller Williams Indpls Metro N
List Price
$220,000
Sold Price
$220,000
Views
24
Current Estimated Value
Home Financials for this Owner
Home Financials are based on the most recent Mortgage that was taken out on this home.
Estimated Appreciation
-$1,642
Avg. Annual Appreciation
-1.69%
Original Mortgage
$176,000
Outstanding Balance
$175,222
Interest Rate
6.67%
Mortgage Type
New Conventional
Estimated Equity
$43,136
Purchase Details
Listed on
Nov 6, 2022
Closed on
Dec 8, 2022
Sold by
Pj Investment Homes Llc
Bought by
Dhaiti Carline
Seller's Agent
Jodi Gandy
Honor Realty LLC
Buyer's Agent
Stacie Kidwell Sandoval
Sandcastle Real Estate, LLC
List Price
$175,000
Sold Price
$175,000
Views
16
Home Financials for this Owner
Home Financials are based on the most recent Mortgage that was taken out on this home.
Avg. Annual Appreciation
10.37%
Original Mortgage
$10,500
Interest Rate
5.54%
Purchase Details
Closed on
Jul 13, 2017
Sold by
Gregory Paul Ray
Purchase Details
Listed on
Jan 5, 2017
Closed on
Mar 17, 2017
Bought by
Gregory Paul Ray
Seller's Agent
Kimberly Gubler
Imperial Realty, LLC
Buyer's Agent
Jodi Gandy
Honor Realty LLC
List Price
$99,500
Sold Price
$94,500
Premium/Discount to List
-$5,000
-5.03%
Home Financials for this Owner
Home Financials are based on the most recent Mortgage that was taken out on this home.
Avg. Annual Appreciation
10.39%
Original Mortgage
$75,600
Interest Rate
4.15%
Mortgage Type
New Conventional
Purchase Details
Closed on
Dec 31, 2016
Sold by
Ocwen Loan Servicing Llc
Bought by
Homeworks Management And Remodeling Llc
Home Financials for this Owner
Home Financials are based on the most recent Mortgage that was taken out on this home.
Interest Rate
4.12%
Similar Homes in Indianapolis, IN
Create a Home Valuation Report for This Property
The Home Valuation Report is an in-depth analysis detailing your home's value as well as a comparison with similar homes in the area
Home Values in the Area
Average Home Value in this Area
Purchase History
| Date | Type | Sale Price | Title Company |
|---|---|---|---|
| Warranty Deed | -- | None Listed On Document | |
| Warranty Deed | $175,000 | -- | |
| Deed | -- | -- | |
| Warranty Deed | -- | -- | |
| Deed | $94,500 | -- | |
| Deed | -- | First American Title | |
| Sheriffs Deed | $51,801 | None Available |
Source: Public Records
Mortgage History
| Date | Status | Loan Amount | Loan Type |
|---|---|---|---|
| Open | $176,000 | New Conventional | |
| Previous Owner | $10,500 | No Value Available | |
| Previous Owner | $169,750 | New Conventional | |
| Previous Owner | $10,500 | New Conventional | |
| Previous Owner | $169,750 | New Conventional | |
| Previous Owner | $75,600 | New Conventional | |
| Previous Owner | -- | No Value Available | |
| Previous Owner | $74,000 | New Conventional |
Source: Public Records
Property History
| Date | Event | Price | Change | Sq Ft Price |
|---|---|---|---|---|
| 04/02/2025 04/02/25 | Sold | $220,000 | 0.0% | $161 / Sq Ft |
| 03/04/2025 03/04/25 | Pending | -- | -- | -- |
| 02/21/2025 02/21/25 | For Sale | $220,000 | +25.7% | $161 / Sq Ft |
| 12/09/2022 12/09/22 | Sold | $175,000 | 0.0% | $128 / Sq Ft |
| 11/09/2022 11/09/22 | Pending | -- | -- | -- |
| 11/06/2022 11/06/22 | For Sale | $175,000 | +85.2% | $128 / Sq Ft |
| 03/22/2017 03/22/17 | Sold | $94,500 | 0.0% | $69 / Sq Ft |
| 03/09/2017 03/09/17 | Rented | $1,000 | 0.0% | -- |
| 03/06/2017 03/06/17 | Under Contract | -- | -- | -- |
| 02/17/2017 02/17/17 | For Rent | $1,000 | 0.0% | -- |
| 01/06/2017 01/06/17 | Pending | -- | -- | -- |
| 01/05/2017 01/05/17 | For Sale | $99,500 | -- | $73 / Sq Ft |
Source: MIBOR Broker Listing Cooperative®
Tax History Compared to Growth
Tax History
| Year | Tax Paid | Tax Assessment Tax Assessment Total Assessment is a certain percentage of the fair market value that is determined by local assessors to be the total taxable value of land and additions on the property. | Land | Improvement |
|---|---|---|---|---|
| 2024 | $1,461 | $152,400 | $20,300 | $132,100 |
| 2023 | $1,461 | $159,400 | $20,300 | $139,100 |
| 2022 | $1,157 | $125,100 | $20,300 | $104,800 |
| 2021 | $2,237 | $108,500 | $6,300 | $102,200 |
| 2020 | $2,140 | $103,700 | $6,300 | $97,400 |
| 2019 | $2,058 | $99,700 | $6,300 | $93,400 |
| 2018 | $1,835 | $88,600 | $6,300 | $82,300 |
| 2017 | $1,466 | $70,200 | $6,300 | $63,900 |
| 2016 | $1,443 | $69,100 | $6,300 | $62,800 |
| 2014 | $1,174 | $58,700 | $6,300 | $52,400 |
| 2013 | $1,185 | $58,700 | $6,300 | $52,400 |
Source: Public Records
Agents Affiliated with this Home
-
Stacie Kidwell Sandoval
Seller's Agent in 2025
Stacie Kidwell Sandoval
F.C. Tucker Company
(317) 436-4004
8 in this area
337 Total Sales
-
Peter Stewart
Buyer's Agent in 2025
Peter Stewart
Keller Williams Indpls Metro N
(317) 450-9202
3 in this area
439 Total Sales
-
J
Seller's Agent in 2022
Jodi Gandy
Honor Realty LLC
-
Kimberly Gubler
Seller's Agent in 2017
Kimberly Gubler
Imperial Realty, LLC
51 Total Sales
-
Jeremy Tallman
Seller's Agent in 2017
Jeremy Tallman
T&H Realty Services, Inc.
(317) 442-3010
2 Total Sales
-
C
Seller Co-Listing Agent in 2017
Claire Holdsworth
JUST LIV, LLC
Map
Source: MIBOR Broker Listing Cooperative®
MLS Number: 22023367
APN: 49-05-13-105-001.006-674
Disclaimer: Certain information contained herein is derived from information provided by parties other than Homes.com. All information provided is deemed reliable, but is not guaranteed to be accurate and should be independently verified.
![]() Based on information submitted to the MLS GRID. All data is obtained from various sources and may not have been verified by broker or MLS GRID. Supplied Open House Information is subject to change without notice. All information should be independently reviewed and verified for accuracy. Properties may or may not be listed by the office/agent presenting the information. Some IDX listings have been excluded from this website.
Based on information submitted to the MLS GRID. All data is obtained from various sources and may not have been verified by broker or MLS GRID. Supplied Open House Information is subject to change without notice. All information should be independently reviewed and verified for accuracy. Properties may or may not be listed by the office/agent presenting the information. Some IDX listings have been excluded from this website.
Nearby Homes
- 4437 Fullwood Ct
- 4363 Fullwood Ct
- 4661 Falcon Run Way
- 4665 Falcon Run Way
- 4107 Eisenhower Dr
- 4020 Eisenhower Dr
- 4025 Sherlock Dr
- 5102 Pike Creek Ln
- 6009 Tammin Dr
- 4825 May Ridge Ln
- 5043 Lewiston Dr
- 5025 Flame Way
- 3991 Bennett Dr
- 4941 Clarkson Dr
- 3938 N Vinewood Ave
- 6137 Apache Dr
- 6340 Commons Dr
- 5903 Brookville Lake Dr
- 4907 Tuscany Ln
- 6249 Apache Dr