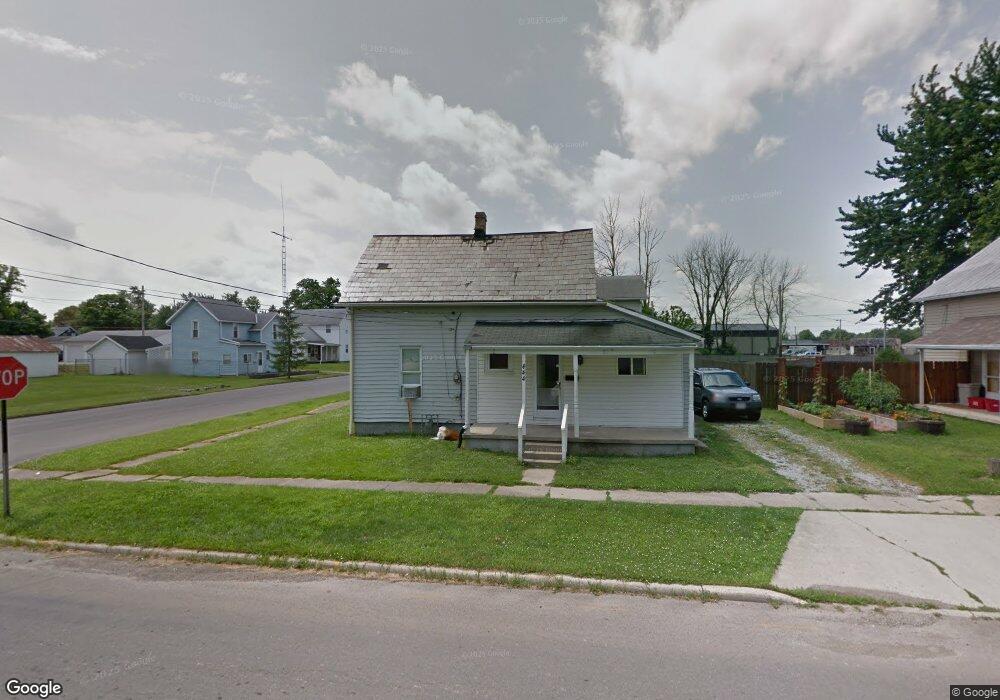
444 S Wayne St Kenton, OH 43326
Estimated Value: $71,212 - $112,000
3
Beds
1
Bath
856
Sq Ft
$107/Sq Ft
Est. Value
About This Home
This home is located at 444 S Wayne St, Kenton, OH 43326 and is currently estimated at $91,553, approximately $106 per square foot. 444 S Wayne St is a home located in Hardin County with nearby schools including Kenton Elementary School, Kenton Middle School, and Kenton High School.
Ownership History
Date
Name
Owned For
Owner Type
Purchase Details
Closed on
May 2, 2018
Sold by
Schmelzer Joseph E and Schmelzer Kati E
Bought by
Wbml Properties Llc
Current Estimated Value
Purchase Details
Closed on
Feb 19, 2016
Sold by
Burchiel James
Bought by
Schmelzer Joseph E and Schmelzer Kati E
Purchase Details
Closed on
May 20, 2011
Sold by
Baughman Gerald E
Bought by
Burchiel James
Purchase Details
Closed on
Mar 21, 2001
Bought by
Baughman Gerald E and Baughman Beck
Purchase Details
Closed on
Jul 18, 1996
Bought by
Baughman Ii Gerald E and Baughman T
Purchase Details
Closed on
May 4, 1993
Bought by
Manns Brian D and Manns Robin S
Purchase Details
Closed on
Dec 22, 1992
Purchase Details
Closed on
Feb 16, 1992
Purchase Details
Closed on
Jul 2, 1991
Create a Home Valuation Report for This Property
The Home Valuation Report is an in-depth analysis detailing your home's value as well as a comparison with similar homes in the area
Home Values in the Area
Average Home Value in this Area
Purchase History
| Date | Buyer | Sale Price | Title Company |
|---|---|---|---|
| Wbml Properties Llc | $30,000 | None Available | |
| Schmelzer Joseph E | $24,000 | None Available | |
| Burchiel James | $13,000 | None Available | |
| Baughman Gerald E | $23,900 | -- | |
| Baughman Ii Gerald E | $23,700 | -- | |
| Manns Brian D | $26,000 | -- | |
| -- | $14,500 | -- | |
| -- | $17,000 | -- | |
| -- | $5,500 | -- |
Source: Public Records
Tax History Compared to Growth
Tax History
| Year | Tax Paid | Tax Assessment Tax Assessment Total Assessment is a certain percentage of the fair market value that is determined by local assessors to be the total taxable value of land and additions on the property. | Land | Improvement |
|---|---|---|---|---|
| 2024 | $1,134 | $17,650 | $1,680 | $15,970 |
| 2023 | $1,134 | $17,650 | $1,680 | $15,970 |
| 2022 | $612 | $12,650 | $1,190 | $11,460 |
| 2021 | $614 | $12,650 | $1,190 | $11,460 |
| 2020 | $637 | $12,650 | $1,190 | $11,460 |
| 2019 | $617 | $10,440 | $1,130 | $9,310 |
| 2018 | $432 | $10,440 | $1,130 | $9,310 |
| 2017 | $311 | $10,440 | $1,130 | $9,310 |
| 2016 | $449 | $11,570 | $1,240 | $10,330 |
| 2015 | $428 | $11,570 | $1,240 | $10,330 |
| 2014 | $448 | $11,570 | $1,240 | $10,330 |
| 2013 | $510 | $12,710 | $1,240 | $11,470 |
Source: Public Records
Map
Nearby Homes
- 639 S Main St
- 508 Decatur St
- 510 Decatur St
- 121 S High St
- 727 S Detroit St
- 513 E Franklin St
- 530 E Franklin St
- 39 Grape St
- 115 Scioto St
- 219 W Carrol St
- 215 N Main St
- 233 N Main St
- 509 E Carrol St
- 920 Cooper St
- 79 Broadway St
- 310 N Market St
- 328 N Detroit St
- 424 W Carrol St
- 702 W Franklin St Unit 702 1/2
- 0 Ohio 309