Estimated Value: $583,000 - $684,000
3
Beds
2
Baths
2,121
Sq Ft
$293/Sq Ft
Est. Value
About This Home
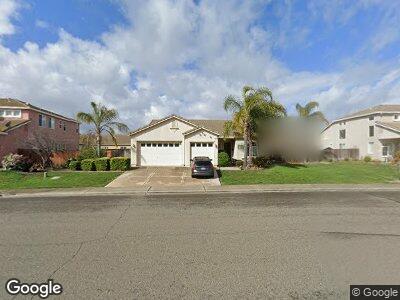
This home is located at 444 Sparrow Dr, Galt, CA 95632 and is currently estimated at $621,292, approximately $292 per square foot. 444 Sparrow Dr is a home located in Sacramento County with nearby schools including Vernon E. Greer Elementary School, Robert L. McCaffrey Middle School, and Galt High School.
Ownership History
Date
Name
Owned For
Owner Type
Purchase Details
Closed on
Oct 31, 2011
Sold by
Garner James M and Garner Mandy A
Bought by
Lethbridge Jacob S and Lethbridge Lynnette
Current Estimated Value
Home Financials for this Owner
Home Financials are based on the most recent Mortgage that was taken out on this home.
Original Mortgage
$207,112
Interest Rate
4.5%
Mortgage Type
FHA
Purchase Details
Closed on
Mar 14, 2007
Sold by
K Hovnanian Forecast Homes Inc
Bought by
Garner James M and Garner Mandy A
Home Financials for this Owner
Home Financials are based on the most recent Mortgage that was taken out on this home.
Original Mortgage
$337,084
Interest Rate
5.62%
Mortgage Type
Purchase Money Mortgage
Create a Home Valuation Report for This Property
The Home Valuation Report is an in-depth analysis detailing your home's value as well as a comparison with similar homes in the area
Home Values in the Area
Average Home Value in this Area
Purchase History
| Date | Buyer | Sale Price | Title Company |
|---|---|---|---|
| Lethbridge Jacob S | $212,500 | Stewart Title Of Sacramento | |
| Garner James M | $421,500 | Placer Title Company |
Source: Public Records
Mortgage History
| Date | Status | Borrower | Loan Amount |
|---|---|---|---|
| Open | Lethbridge Jacob S | $359,449 | |
| Closed | Lethbridge Jacob S | $360,272 | |
| Closed | Lethbridge Jacob S | $290,437 | |
| Closed | Lethbridge Jacob S | $227,513 | |
| Closed | Lethbridge Jacob S | $207,112 | |
| Previous Owner | Garner James M | $337,084 |
Source: Public Records
Tax History Compared to Growth
Tax History
| Year | Tax Paid | Tax Assessment Tax Assessment Total Assessment is a certain percentage of the fair market value that is determined by local assessors to be the total taxable value of land and additions on the property. | Land | Improvement |
|---|---|---|---|---|
| 2024 | $4,022 | $261,666 | $61,565 | $200,101 |
| 2023 | $3,932 | $256,536 | $60,358 | $196,178 |
| 2022 | $3,764 | $251,507 | $59,175 | $192,332 |
| 2021 | $3,705 | $246,576 | $58,015 | $188,561 |
| 2020 | $3,653 | $244,049 | $57,421 | $186,628 |
| 2019 | $3,557 | $239,265 | $56,296 | $182,969 |
| 2018 | $3,519 | $234,575 | $55,193 | $179,382 |
| 2017 | $3,387 | $229,976 | $54,111 | $175,865 |
| 2016 | $3,259 | $225,467 | $53,050 | $172,417 |
| 2015 | $3,151 | $222,082 | $52,254 | $169,828 |
| 2014 | $3,124 | $217,733 | $51,231 | $166,502 |
Source: Public Records
Map
Nearby Homes
- 414 Geranium Cir
- 443 Geranium Cir
- 171 Robin Ct
- 10035 Pringle Ave
- 45 Sunshine Dr
- 10201 Pringle Ave
- 10000 Live Oak Ave
- 0 Mcfarland St
- 13390 Mcfarland St
- 117 Matthew Ct
- 10183 Pringle Ave
- 13703 Christensen Rd
- 176 A St
- 326 Oak Ave
- 604 Pringle Ave
- 604 Pringle Ave Unit 65
- 604 Pringle Ave Unit 127
- 604 Pringle Ave Unit 94
- 180 Saddle Ct
- 605 Pringle Ave Unit 9
- 444 Sparrow Dr
- 450 Sparrow Dr
- 438 Sparrow Dr
- 425 Geranium Cir
- 431 Geranium Cir
- 419 Geranium Cir
- 443 Sparrow Dr
- 445 Sparrow Dr
- 456 Sparrow Dr
- 432 Sparrow Dr
- 449 Sparrow Dr
- 437 Sparrow Dr
- 413 Geranium Cir
- 437 Geranium Cir
- 455 Sparrow Dr
- 432 Geranium Cir
- 426 Geranium Cir
- 462 Sparrow Dr
- 255 Daisy Ct
- 438 Geranium Cir