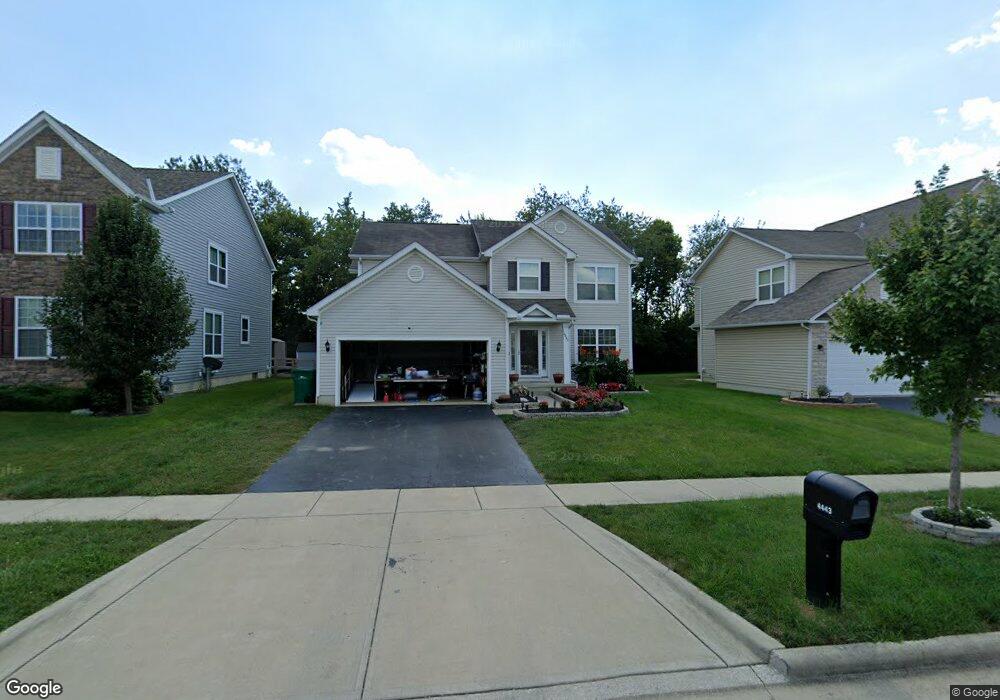
4443 Butler Farms Dr Unit BUT17 Columbus, OH 43207
Obetz-Lockbourne NeighborhoodEstimated Value: $352,494 - $396,000
4
Beds
3
Baths
2,075
Sq Ft
$183/Sq Ft
Est. Value
About This Home
This home is located at 4443 Butler Farms Dr Unit BUT17, Columbus, OH 43207 and is currently estimated at $378,874, approximately $182 per square foot. 4443 Butler Farms Dr Unit BUT17 is a home located in Franklin County with nearby schools including Hamilton Elementary School, Hamilton Intermediate School, and Hamilton Middle School.
Ownership History
Date
Name
Owned For
Owner Type
Purchase Details
Closed on
Mar 22, 2019
Sold by
Princeton Holdings Llc
Bought by
Saunders Shawand and Saunders Katrina
Current Estimated Value
Home Financials for this Owner
Home Financials are based on the most recent Mortgage that was taken out on this home.
Original Mortgage
$201,188
Outstanding Balance
$178,928
Interest Rate
4.99%
Mortgage Type
FHA
Estimated Equity
$199,946
Purchase Details
Closed on
Jan 31, 2016
Sold by
Delong David A and Delong Melinda T
Bought by
Princeton Holdings Llc
Purchase Details
Closed on
Sep 16, 2011
Sold by
Rockford Homes Inc
Bought by
Delong David A and Delong Melinda T
Create a Home Valuation Report for This Property
The Home Valuation Report is an in-depth analysis detailing your home's value as well as a comparison with similar homes in the area
Home Values in the Area
Average Home Value in this Area
Purchase History
| Date | Buyer | Sale Price | Title Company |
|---|---|---|---|
| Saunders Shawand | $204,900 | Allodial Title Llc | |
| Princeton Holdings Llc | $140,000 | Great American Title Agency | |
| Delong David A | $180,000 | Title First |
Source: Public Records
Mortgage History
| Date | Status | Borrower | Loan Amount |
|---|---|---|---|
| Open | Saunders Shawand | $201,188 |
Source: Public Records
Tax History Compared to Growth
Tax History
| Year | Tax Paid | Tax Assessment Tax Assessment Total Assessment is a certain percentage of the fair market value that is determined by local assessors to be the total taxable value of land and additions on the property. | Land | Improvement |
|---|---|---|---|---|
| 2024 | $5,216 | $110,570 | $33,600 | $76,970 |
| 2023 | $5,137 | $110,565 | $33,600 | $76,965 |
| 2022 | $3,931 | $71,650 | $5,740 | $65,910 |
| 2021 | $3,984 | $71,650 | $5,740 | $65,910 |
| 2020 | $4,056 | $71,650 | $5,740 | $65,910 |
| 2019 | $3,895 | $59,720 | $4,800 | $54,920 |
| 2018 | $3,962 | $59,720 | $4,800 | $54,920 |
| 2017 | $3,746 | $59,720 | $4,800 | $54,920 |
| 2016 | $4,232 | $63,950 | $12,360 | $51,590 |
| 2015 | $4,019 | $63,950 | $12,360 | $51,590 |
| 2014 | $3,998 | $63,950 | $12,360 | $51,590 |
| 2013 | $1,927 | $63,945 | $12,355 | $51,590 |
Source: Public Records
Map
Nearby Homes
- 4241 Gelbray Ct
- 4175 Holstein Dr
- 4410 Holstein Dr
- 4455 Catamaran Dr
- 4412 Catamaran Dr
- 1341 Halfhill Way
- 791 Scarlett Ln
- 4344 Brett Ln
- 4309 Salt Spring Ln
- 4297 Salt Spring Ln
- 1099 Secrest Ave
- 4231 Umiak Dr
- 1059 Belford Ave
- 1193 Rendezvous Ln
- 4990 Root Place
- 4451 1/2 Lockbourne Rd Unit R
- 1101 Meadow Ln
- 812 Breathitt Ave
- 1292 Webb Dr Unit Lot 83
- 5081 Lockbourne Rd
- 4443 Butler Farms Dr
- 4439 Butler Farms Dr
- 4436 Butler Farms Dr
- 4436 Butler Farms Dr Unit 49
- 4449 Butler Farms Dr
- 4432 Butler Farms Dr
- 4437 Butler Farms Dr
- 4438 Butler Farms Dr
- 4430 Butler Farms Dr
- 4451 Butler Farms Dr
- 4435 Butler Farms Dr
- 4440 Butler Farms Dr
- 4442 Butler Farms Dr
- 4453 Butler Farms Dr
- 1069 Gartner Ct
- 4431 Butler Farms Dr
- 1061 Gartner Ct Unit 44
- 1085 Gartner Ct
- 1031 Garnter Dr
- 4444 Butler Farms Dr