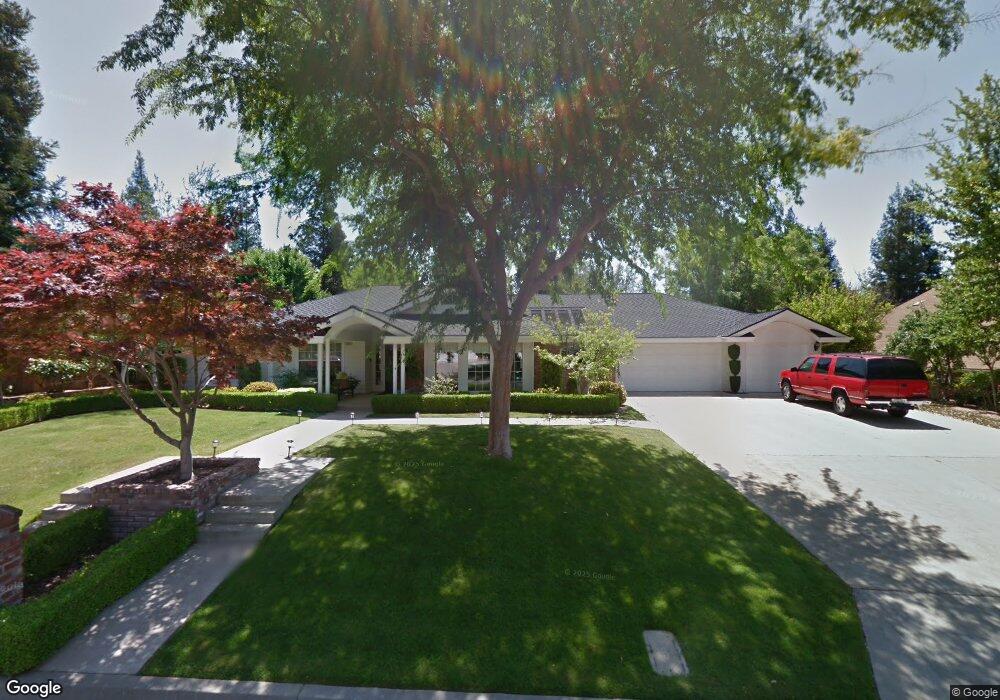
445 E Balfour Ave Fresno, CA 93720
Woodward Park NeighborhoodEstimated Value: $724,000 - $795,563
4
Beds
3
Baths
3,026
Sq Ft
$255/Sq Ft
Est. Value
About This Home
This home is located at 445 E Balfour Ave, Fresno, CA 93720 and is currently estimated at $771,641, approximately $255 per square foot. 445 E Balfour Ave is a home located in Fresno County with nearby schools including East Elementary School, Valley Oak Elementary School, and Kastner Intermediate School.
Ownership History
Date
Name
Owned For
Owner Type
Purchase Details
Closed on
Jul 28, 2015
Sold by
Harbin Susan B and Balderama Olga A
Bought by
The Harbin 2015 Revocable Trust and Balderama Olga A
Current Estimated Value
Purchase Details
Closed on
Mar 3, 2010
Sold by
Asbury William Joseph
Bought by
Asbury William Joseph
Purchase Details
Closed on
Aug 30, 1995
Sold by
Asbury Deborah H
Bought by
Asbury William Joseph
Home Financials for this Owner
Home Financials are based on the most recent Mortgage that was taken out on this home.
Original Mortgage
$247,500
Interest Rate
7.88%
Purchase Details
Closed on
Aug 3, 1995
Sold by
Prudential Residential Services Ltd Part
Bought by
Asbury William Joseph
Home Financials for this Owner
Home Financials are based on the most recent Mortgage that was taken out on this home.
Original Mortgage
$247,500
Interest Rate
7.88%
Purchase Details
Closed on
Jan 4, 1995
Sold by
Marasco Richard J and Marasco Kimberly G
Bought by
Prudential Residential Services Ltd Part
Create a Home Valuation Report for This Property
The Home Valuation Report is an in-depth analysis detailing your home's value as well as a comparison with similar homes in the area
Home Values in the Area
Average Home Value in this Area
Purchase History
| Date | Buyer | Sale Price | Title Company |
|---|---|---|---|
| The Harbin 2015 Revocable Trust | -- | None Available | |
| Asbury William Joseph | -- | None Available | |
| Asbury William Joseph | -- | American Title Insurance | |
| Asbury William Joseph | $275,000 | American Title | |
| Prudential Residential Services Ltd Part | $167,000 | American Title Co |
Source: Public Records
Mortgage History
| Date | Status | Borrower | Loan Amount |
|---|---|---|---|
| Previous Owner | Asbury William Joseph | $247,500 |
Source: Public Records
Tax History Compared to Growth
Tax History
| Year | Tax Paid | Tax Assessment Tax Assessment Total Assessment is a certain percentage of the fair market value that is determined by local assessors to be the total taxable value of land and additions on the property. | Land | Improvement |
|---|---|---|---|---|
| 2025 | $6,357 | $531,580 | $149,501 | $382,079 |
| 2023 | $6,112 | $510,941 | $143,697 | $367,244 |
| 2022 | $6,028 | $500,924 | $140,880 | $360,044 |
| 2021 | $5,858 | $491,103 | $138,118 | $352,985 |
| 2020 | $5,834 | $486,068 | $136,702 | $349,366 |
| 2019 | $5,719 | $476,538 | $134,022 | $342,516 |
| 2018 | $5,592 | $467,195 | $131,395 | $335,800 |
| 2017 | $5,495 | $458,035 | $128,819 | $329,216 |
| 2016 | $5,309 | $449,055 | $126,294 | $322,761 |
| 2015 | $5,226 | $442,310 | $124,397 | $317,913 |
| 2014 | $5,128 | $433,647 | $121,961 | $311,686 |
Source: Public Records
Map
Nearby Homes
- 564 E Braddock Dr
- 9094 N Cherryhill Ln
- 369 E Lindbrook Ln
- 364 E Marwood Ln
- 9150 N Woodlawn Dr
- 9260 N Green Meadows Ln
- 512 E Kelso Ave
- 316 E Lester Ave
- 9224 N Stoneridge Ln
- 793 E Buckhill Rd
- 787 E Buckhill Rd
- 909 E Edgemont Dr
- 955 E Foxhill Dr
- 645 E Champlain Dr Unit 123
- 9659 N Shenandoah Ln
- 1094 E Monticello Cir
- 8754 N Millbrook Ave
- 920 E Windsor Cir
- 1123 E Cole Ave
- 1353 E Saint James Cir
- 467 E Balfour Ave
- 423 E Balfour Ave
- 9162 N Red Lion Dr
- 9150 N Holyoke Ln
- 414 E Deer Creek Ln
- 436 E Balfour Ave
- 456 E Balfour Ave
- 485 E Balfour Ave
- 401 E Balfour Ave
- 9150 N Red Lion Dr
- 9151 N Holyoke Ln
- 416 E Balfour Ave
- 402 E Deer Creek Ln
- 486 E Balfour Ave
- 9140 N Holyoke Ln
- 9138 N Red Lion Dr
- 392 E Deer Creek Ln
- 411 E Deer Creek Ln
- 396 E Balfour Ave
- 9251 N Hilltop Ct