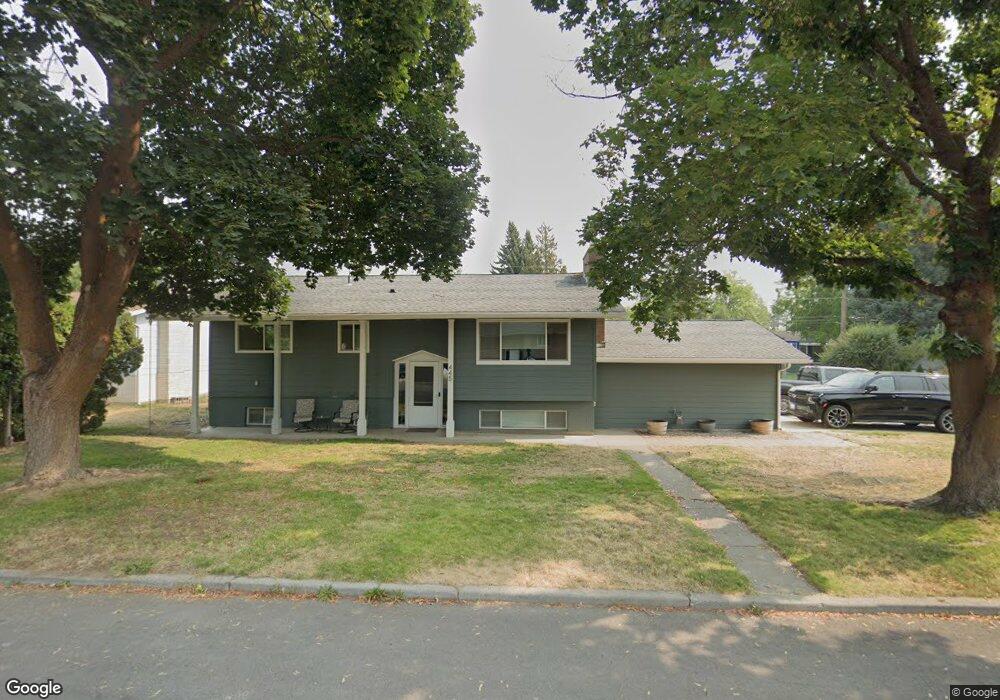
445 N 3rd St Cheney, WA 99004
Estimated Value: $388,042 - $390,000
4
Beds
3
Baths
1,848
Sq Ft
$211/Sq Ft
Est. Value
About This Home
This home is located at 445 N 3rd St, Cheney, WA 99004 and is currently estimated at $389,261, approximately $210 per square foot. 445 N 3rd St is a home located in Spokane County with nearby schools including Betz Elementary School, Cheney Middle School, and Cheney High School.
Ownership History
Date
Name
Owned For
Owner Type
Purchase Details
Closed on
Nov 2, 2016
Sold by
Christenson Richard E
Bought by
Fuhrman Mica and Fuhrman Connor
Current Estimated Value
Home Financials for this Owner
Home Financials are based on the most recent Mortgage that was taken out on this home.
Original Mortgage
$160,000
Outstanding Balance
$128,695
Interest Rate
3.48%
Mortgage Type
New Conventional
Estimated Equity
$260,566
Purchase Details
Closed on
Jul 12, 1999
Sold by
Christenson Richard E
Bought by
Christenson Richard E and Christenson Living Trust
Create a Home Valuation Report for This Property
The Home Valuation Report is an in-depth analysis detailing your home's value as well as a comparison with similar homes in the area
Home Values in the Area
Average Home Value in this Area
Purchase History
| Date | Buyer | Sale Price | Title Company |
|---|---|---|---|
| Fuhrman Mica | $170,000 | Spokane County Title Company | |
| Christenson Richard E | -- | -- |
Source: Public Records
Mortgage History
| Date | Status | Borrower | Loan Amount |
|---|---|---|---|
| Open | Fuhrman Mica | $160,000 |
Source: Public Records
Tax History Compared to Growth
Tax History
| Year | Tax Paid | Tax Assessment Tax Assessment Total Assessment is a certain percentage of the fair market value that is determined by local assessors to be the total taxable value of land and additions on the property. | Land | Improvement |
|---|---|---|---|---|
| 2025 | $3,704 | $331,800 | $75,000 | $256,800 |
| 2024 | $3,704 | $336,000 | $75,000 | $261,000 |
| 2023 | $2,596 | $343,900 | $75,000 | $268,900 |
| 2022 | $2,638 | $309,700 | $60,000 | $249,700 |
| 2021 | $2,430 | $212,300 | $36,500 | $175,800 |
| 2020 | $2,353 | $192,700 | $33,000 | $159,700 |
| 2019 | $2,010 | $173,100 | $33,000 | $140,100 |
| 2018 | $2,208 | $165,600 | $27,000 | $138,600 |
| 2017 | $1,869 | $154,800 | $27,000 | $127,800 |
| 2016 | $1,874 | $149,600 | $24,000 | $125,600 |
| 2015 | $1,737 | $141,000 | $24,000 | $117,000 |
| 2014 | -- | $141,000 | $24,000 | $117,000 |
| 2013 | -- | $0 | $0 | $0 |
Source: Public Records
Map
Nearby Homes
- 1514 3rd St
- 1714 4th St
- 311 Peach Tree Ct Unit Lot 4 Block 3 - Orch
- 311 Peach Tree Ct
- 307 Peach Tree Ct
- 307 Peach Tree Ct Unit Lot 5 Block 3 - Clea
- 318 Plum Tree Ct Unit Lot 10 Block 3 - Sno
- 2320 Annie Place Unit Lot 14 Block 2 - Sno
- 2414 Annie Place Unit Lot 10 Block 2 - Cle
- 2331 Annie Place Unit Lot 12 Block 3 - Sno
- 2406 Annie Place Unit Lot 11 Block 2 - Hud
- 417 Clay St Unit A
- 329 Peach Tree Ct Unit Lot 1 Block 3 - Snow
- 329 Peach Tree Ct
- 323 Peach Tree Ct
- 323 Peach Tree Ct Unit Lot 2 Block 3 - Huds
- 317 Peach Tree Ct Unit Lot 3 Block 3 - Orch
- 317 Peach Tree Ct
- 315 Plum Tree Ct
- 302 Plum Tree Ct Unit Lot 18 Block 3 - Hud