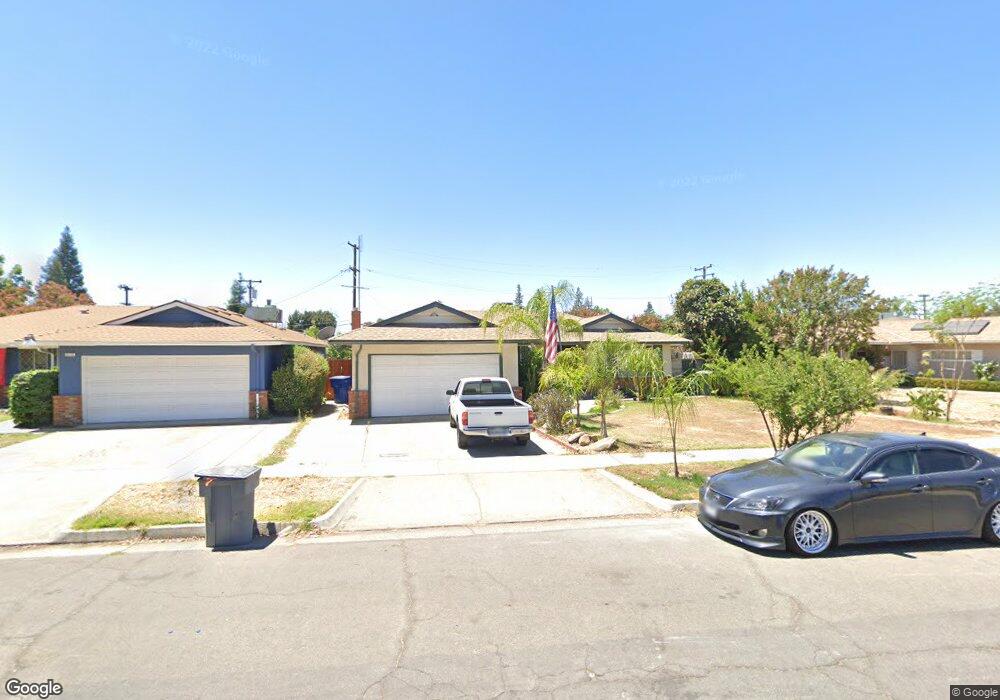
4464 E Robinson Ave Fresno, CA 93726
McLane NeighborhoodEstimated Value: $343,000 - $362,000
3
Beds
2
Baths
1,647
Sq Ft
$214/Sq Ft
Est. Value
About This Home
This home is located at 4464 E Robinson Ave, Fresno, CA 93726 and is currently estimated at $351,744, approximately $213 per square foot. 4464 E Robinson Ave is a home located in Fresno County with nearby schools including Centennial Elementary School, Tioga Middle School, and Herbert Hoover High School.
Ownership History
Date
Name
Owned For
Owner Type
Purchase Details
Closed on
May 6, 2005
Sold by
Vongsanit Sam
Bought by
Vongsanit Sam and Tankhai Phong
Current Estimated Value
Home Financials for this Owner
Home Financials are based on the most recent Mortgage that was taken out on this home.
Original Mortgage
$200,000
Outstanding Balance
$105,484
Interest Rate
6.02%
Mortgage Type
New Conventional
Estimated Equity
$246,260
Purchase Details
Closed on
Nov 16, 1999
Sold by
Fisher Dannie H and Fisher Charlotte A
Bought by
Vongsanit Sam
Home Financials for this Owner
Home Financials are based on the most recent Mortgage that was taken out on this home.
Original Mortgage
$86,300
Interest Rate
7.84%
Purchase Details
Closed on
Jan 3, 1994
Sold by
Fisher Dannie H
Bought by
Fisher Dannie H and Fisher Charlotte A
Home Financials for this Owner
Home Financials are based on the most recent Mortgage that was taken out on this home.
Original Mortgage
$71,000
Interest Rate
4%
Create a Home Valuation Report for This Property
The Home Valuation Report is an in-depth analysis detailing your home's value as well as a comparison with similar homes in the area
Home Values in the Area
Average Home Value in this Area
Purchase History
| Date | Buyer | Sale Price | Title Company |
|---|---|---|---|
| Vongsanit Sam | -- | Fidelity National Title Co | |
| Vongsanit Sam | $89,000 | Stewart Title | |
| Vongsanit Sam | -- | Stewart Title | |
| Fisher Dannie H | -- | Commonwealth Land Title Ins |
Source: Public Records
Mortgage History
| Date | Status | Borrower | Loan Amount |
|---|---|---|---|
| Open | Vongsanit Sam | $200,000 | |
| Closed | Vongsanit Sam | $86,300 | |
| Previous Owner | Fisher Dannie H | $71,000 |
Source: Public Records
Tax History
| Year | Tax Paid | Tax Assessment Tax Assessment Total Assessment is a certain percentage of the fair market value that is determined by local assessors to be the total taxable value of land and additions on the property. | Land | Improvement |
|---|---|---|---|---|
| 2025 | $1,587 | $128,312 | $36,874 | $91,438 |
| 2023 | $1,495 | $123,332 | $35,443 | $87,889 |
| 2022 | $1,473 | $120,915 | $34,749 | $86,166 |
| 2021 | $4,701 | $118,545 | $34,068 | $84,477 |
| 2020 | $4,649 | $117,330 | $33,719 | $83,611 |
| 2019 | $4,688 | $122,608 | $33,058 | $89,550 |
| 2018 | $4,649 | $120,205 | $32,410 | $87,795 |
| 2017 | $4,603 | $117,849 | $31,775 | $86,074 |
| 2016 | $1,355 | $115,539 | $31,152 | $84,387 |
| 2015 | $1,334 | $113,805 | $30,685 | $83,120 |
| 2014 | $1,307 | $111,576 | $30,084 | $81,492 |
Source: Public Records
Map
Nearby Homes
- 4074 E Robinson Ave
- 4115 E Dayton Ave
- 4052 E Farrin Ave
- 4031 E Pontiac Way
- 4636 E Cortland Ave
- 3905 E Cortland Ave
- 3934 E Sussex Way
- 4045 E Bellaire Way
- 4104 E Ashlan Ave
- 4137 E Cornell Ave
- 3715 E Garland Ave
- 4633 E Cornell Ave
- 4295 N Archie Ave
- 4324 E Richert Ave
- 3789 E Hampton Way
- 2936 N Spalding Ave
- 3719 E Hampton Way Unit 2
- 3605 E Cortland Ave
- 3495 E Dakota Ave
- 4161 E Holland Ave
- 4452 E Robinson Ave
- 4476 E Robinson Ave
- 4439 E Garland Ave
- 4440 E Robinson Ave
- 4484 E Robinson Ave
- 4445 E Garland Ave
- 4475 E Robinson Ave
- 4463 E Robinson Ave
- 4433 E Garland Ave
- 4430 E Robinson Ave
- 4487 E Robinson Ave
- 4451 E Robinson Ave
- 4496 E Robinson Ave
- 4471 E Garland Ave
- 4441 E Robinson Ave
- 4451 E Garland Ave
- 3761 N Barton Ave
- 4483 E Garland Ave
- 4418 E Robinson Ave
- 4427 E Garland Ave
Your Personal Tour Guide
Ask me questions while you tour the home.