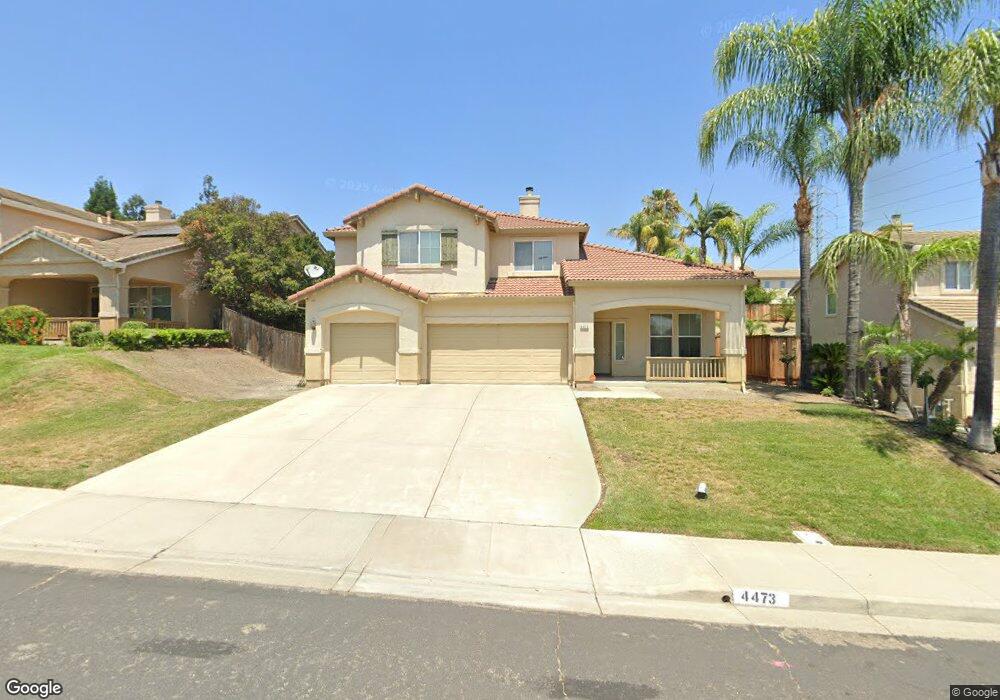
4473 Buckskin Dr Antioch, CA 94531
Deer Valley NeighborhoodEstimated Value: $685,094 - $806,000
4
Beds
3
Baths
2,399
Sq Ft
$300/Sq Ft
Est. Value
About This Home
This home is located at 4473 Buckskin Dr, Antioch, CA 94531 and is currently estimated at $719,774, approximately $300 per square foot. 4473 Buckskin Dr is a home located in Contra Costa County with nearby schools including Jack London Elementary School, Black Diamond Middle School, and Deer Valley High School.
Ownership History
Date
Name
Owned For
Owner Type
Purchase Details
Closed on
Mar 17, 2025
Sold by
Jones Vercy Lee and Tracey Deanne
Bought by
Tracey And Vercy Jones Jr Revocable Living Tr and Jones
Current Estimated Value
Purchase Details
Closed on
Feb 12, 2021
Sold by
Jones Tracey D and Jones Vercy L
Bought by
Jones Tracey D and Jones Vercy L
Home Financials for this Owner
Home Financials are based on the most recent Mortgage that was taken out on this home.
Original Mortgage
$299,500
Interest Rate
2.65%
Mortgage Type
New Conventional
Purchase Details
Closed on
Jul 20, 1999
Sold by
Ponderosa Industries Inc
Bought by
Jones Vercy L and Jones Tracey D
Home Financials for this Owner
Home Financials are based on the most recent Mortgage that was taken out on this home.
Original Mortgage
$238,111
Interest Rate
7.64%
Mortgage Type
Purchase Money Mortgage
Create a Home Valuation Report for This Property
The Home Valuation Report is an in-depth analysis detailing your home's value as well as a comparison with similar homes in the area
Home Values in the Area
Average Home Value in this Area
Purchase History
| Date | Buyer | Sale Price | Title Company |
|---|---|---|---|
| Tracey And Vercy Jones Jr Revocable Living Tr | -- | None Listed On Document | |
| Jones Tracey D | -- | Fidelity National Title Co | |
| Jones Vercy L | $251,000 | First American Title Guarant |
Source: Public Records
Mortgage History
| Date | Status | Borrower | Loan Amount |
|---|---|---|---|
| Previous Owner | Jones Tracey D | $299,500 | |
| Previous Owner | Jones Vercy L | $238,111 |
Source: Public Records
Tax History
| Year | Tax Paid | Tax Assessment Tax Assessment Total Assessment is a certain percentage of the fair market value that is determined by local assessors to be the total taxable value of land and additions on the property. | Land | Improvement |
|---|---|---|---|---|
| 2025 | $4,721 | $387,605 | $76,838 | $310,767 |
| 2024 | $4,441 | $380,006 | $75,332 | $304,674 |
| 2023 | $4,441 | $372,555 | $73,855 | $298,700 |
| 2022 | $4,374 | $365,251 | $72,407 | $292,844 |
| 2021 | $4,243 | $358,090 | $70,988 | $287,102 |
| 2019 | $4,145 | $347,472 | $68,884 | $278,588 |
| 2018 | $3,989 | $340,660 | $67,534 | $273,126 |
| 2017 | $3,906 | $333,981 | $66,210 | $267,771 |
| 2016 | $3,810 | $327,433 | $64,912 | $262,521 |
| 2015 | $4,097 | $322,515 | $63,937 | $258,578 |
| 2014 | $5,137 | $316,198 | $62,685 | $253,513 |
Source: Public Records
Map
Nearby Homes
- 4520 Beaver Ct
- 2720 Asilomar Dr
- 2504 Brocket Ct
- 4404 Deerfield Dr
- 4437 Deerfield Dr
- 4442 Deerfield Dr
- 2753 Asilomar Dr
- 2328 Grassland Way
- 2600 Covelite Way
- 2497 Covelite Way
- 3237 Oso Grande Way
- 2754 Winding Ln
- 2703 Ivy Ln
- 2415 Crystal Way
- 2910 Winding Ln Unit 64
- 4508 Muledeer Ct
- 4100 Diorite Ct
- 4750 Sterling Hill Dr
- 2451 Carpinteria Dr
- 4528 Fallow Way
- 4477 Buckskin Dr
- 4469 Buckskin Dr
- 4454 Buckeye Way
- 4450 Buckeye Way
- 4465 Buckskin Dr
- 4481 Buckskin Dr
- 4458 Buckeye Way
- 4500 Deer Way
- 4446 Buckeye Way
- 4462 Buckeye Way
- 4461 Buckskin Dr
- 4501 Deer Way
- 4501 Steed Way
- 4442 Buckeye Way
- 4504 Deer Way
- 4457 Buckskin Dr
- 4505 Deer Way
- 2650 Jaguar Way
- 4505 Steed Way
- 4438 Buckeye Way
Your Personal Tour Guide
Ask me questions while you tour the home.