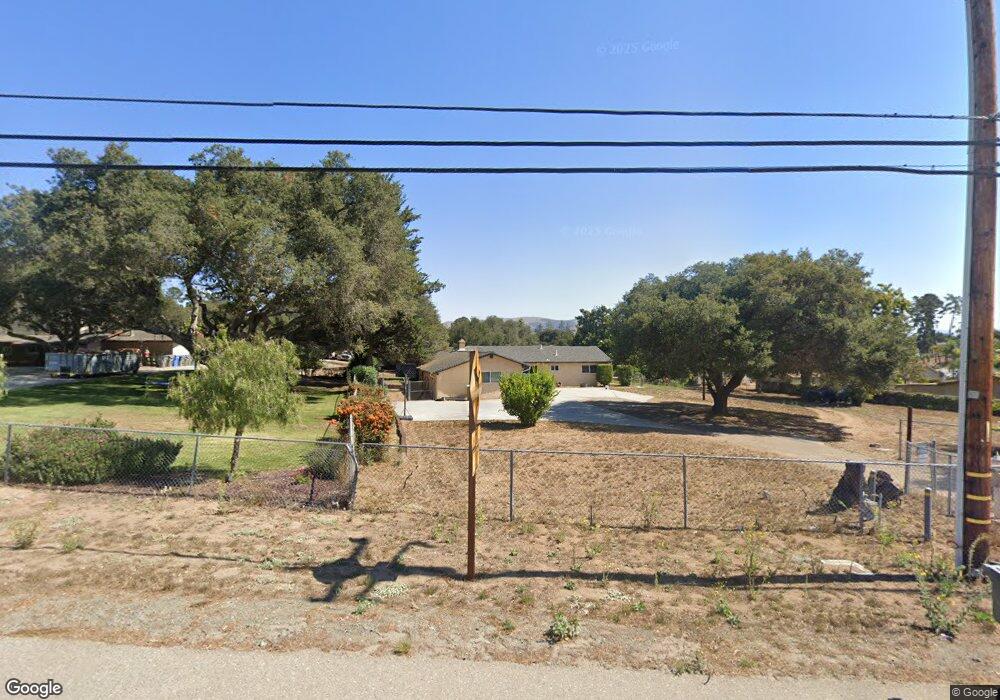
448 Pomeroy Rd Nipomo, CA 93444
Estimated Value: $954,000 - $1,117,229
4
Beds
3
Baths
2,203
Sq Ft
$461/Sq Ft
Est. Value
About This Home
This home is located at 448 Pomeroy Rd, Nipomo, CA 93444 and is currently estimated at $1,016,557, approximately $461 per square foot. 448 Pomeroy Rd is a home located in San Luis Obispo County with nearby schools including Dana Elementary School, Mesa Middle School, and Nipomo High School.
Ownership History
Date
Name
Owned For
Owner Type
Purchase Details
Closed on
Mar 23, 2009
Sold by
Deutsche Bank National Trust Co
Bought by
Burkhammer Christopher D and Burkhammer Brandy M
Current Estimated Value
Home Financials for this Owner
Home Financials are based on the most recent Mortgage that was taken out on this home.
Original Mortgage
$410,718
Interest Rate
4.8%
Mortgage Type
FHA
Purchase Details
Closed on
Sep 4, 2008
Sold by
Cortez Emilio
Bought by
Deutsche Bank National Trust Co
Purchase Details
Closed on
Feb 26, 2007
Sold by
Cortez Emilio
Bought by
Ruiz Robert
Purchase Details
Closed on
Jul 28, 2006
Sold by
Lucas Nancy M
Bought by
Cortez Emilio
Home Financials for this Owner
Home Financials are based on the most recent Mortgage that was taken out on this home.
Original Mortgage
$465,500
Interest Rate
6.43%
Mortgage Type
Unknown
Purchase Details
Closed on
Apr 23, 1998
Sold by
Lucas Robert G and Lucas Nancy M
Bought by
Lucas Robert G and Lucas Nancy M
Create a Home Valuation Report for This Property
The Home Valuation Report is an in-depth analysis detailing your home's value as well as a comparison with similar homes in the area
Home Values in the Area
Average Home Value in this Area
Purchase History
| Date | Buyer | Sale Price | Title Company |
|---|---|---|---|
| Burkhammer Christopher D | $425,000 | First American Title Company | |
| Deutsche Bank National Trust Co | $416,500 | First American Title Ins Co | |
| Ruiz Robert | -- | None Available | |
| Cortez Emilio | $665,000 | Fidelity National Title Co | |
| Lucas Robert G | -- | -- |
Source: Public Records
Mortgage History
| Date | Status | Borrower | Loan Amount |
|---|---|---|---|
| Previous Owner | Burkhammer Christopher D | $410,718 | |
| Previous Owner | Cortez Emilio | $465,500 |
Source: Public Records
Tax History
| Year | Tax Paid | Tax Assessment Tax Assessment Total Assessment is a certain percentage of the fair market value that is determined by local assessors to be the total taxable value of land and additions on the property. | Land | Improvement |
|---|---|---|---|---|
| 2025 | $5,629 | $547,284 | $225,351 | $321,933 |
| 2024 | $5,565 | $536,554 | $220,933 | $315,621 |
| 2023 | $5,565 | $526,034 | $216,601 | $309,433 |
| 2022 | $5,481 | $515,720 | $212,354 | $303,366 |
| 2021 | $5,471 | $505,609 | $208,191 | $297,418 |
| 2020 | $5,408 | $500,426 | $206,057 | $294,369 |
| 2019 | $5,375 | $490,615 | $202,017 | $288,598 |
| 2018 | $5,311 | $480,996 | $198,056 | $282,940 |
| 2017 | $5,212 | $471,566 | $194,173 | $277,393 |
| 2016 | $4,915 | $462,320 | $190,366 | $271,954 |
| 2015 | $4,845 | $455,376 | $187,507 | $267,869 |
| 2014 | $4,665 | $446,456 | $183,834 | $262,622 |
Source: Public Records
Map
Nearby Homes
- 770 & 772 Beverly
- 182 172 E Chestnut
- 745 Inga Rd
- 219 Lema Dr
- 850 Primrose Ln
- 228 Chaparral Ln
- 778 Primrose Ln
- 680 Sweet Donna Place
- 719 W Tefft St
- 1089 Olympic Way
- 680 Hill St
- 160 San Antonio Ln
- 270 S Tejas Place
- 325 Black Hawk Way
- 345 Black Hawk Way
- 375 Kestrel Way
- 449 W Tefft St
- 449 W Tefft St Unit 23
- 449 W Tefft St Unit 22
- 449 W Tefft St Unit 13
Your Personal Tour Guide
Ask me questions while you tour the home.