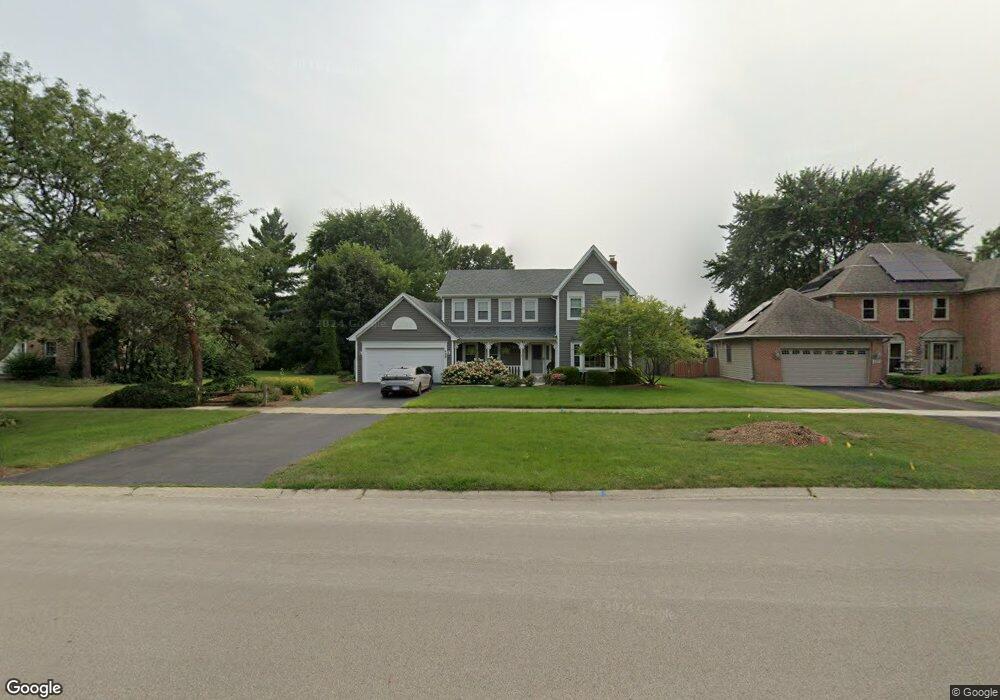
449 Boulder Hill Pass Unit 3 Oswego, IL 60543
North Oswego NeighborhoodEstimated Value: $443,000 - $469,000
4
Beds
3
Baths
2,530
Sq Ft
$180/Sq Ft
Est. Value
About This Home
This home is located at 449 Boulder Hill Pass Unit 3, Oswego, IL 60543 and is currently estimated at $456,543, approximately $180 per square foot. 449 Boulder Hill Pass Unit 3 is a home located in Kendall County with nearby schools including Old Post Elementary School, Thompson Jr. High School, and Oswego High School.
Ownership History
Date
Name
Owned For
Owner Type
Purchase Details
Closed on
Sep 26, 1997
Sold by
Carroll Peter W and Lambakis Jill L
Bought by
Carroll Peter W and Carroll Jill L
Current Estimated Value
Purchase Details
Closed on
Aug 27, 1996
Sold by
Merchants National Bank Of Aurora
Bought by
Carroll Peter W and Lambakis Jill L
Home Financials for this Owner
Home Financials are based on the most recent Mortgage that was taken out on this home.
Original Mortgage
$147,200
Outstanding Balance
$12,339
Interest Rate
7.93%
Estimated Equity
$444,204
Purchase Details
Closed on
Dec 1, 1986
Create a Home Valuation Report for This Property
The Home Valuation Report is an in-depth analysis detailing your home's value as well as a comparison with similar homes in the area
Home Values in the Area
Average Home Value in this Area
Purchase History
| Date | Buyer | Sale Price | Title Company |
|---|---|---|---|
| Carroll Peter W | -- | -- | |
| Carroll Peter W | $184,000 | Law Title Insurance Co | |
| Carroll Peter W | $184,000 | -- | |
| -- | $181,300 | -- |
Source: Public Records
Mortgage History
| Date | Status | Borrower | Loan Amount |
|---|---|---|---|
| Open | Carroll Peter W | $147,200 | |
| Closed | Carroll Peter W | -- |
Source: Public Records
Tax History Compared to Growth
Tax History
| Year | Tax Paid | Tax Assessment Tax Assessment Total Assessment is a certain percentage of the fair market value that is determined by local assessors to be the total taxable value of land and additions on the property. | Land | Improvement |
|---|---|---|---|---|
| 2024 | $9,744 | $127,082 | $26,493 | $100,589 |
| 2023 | $8,775 | $112,462 | $23,445 | $89,017 |
| 2022 | $8,775 | $103,176 | $21,509 | $81,667 |
| 2021 | $8,461 | $96,426 | $20,102 | $76,324 |
| 2020 | $7,869 | $89,283 | $18,613 | $70,670 |
| 2019 | $8,063 | $89,997 | $18,613 | $71,384 |
| 2018 | $7,909 | $85,794 | $17,744 | $68,050 |
| 2017 | $7,842 | $82,495 | $17,062 | $65,433 |
| 2016 | $7,706 | $80,092 | $16,565 | $63,527 |
| 2015 | $7,911 | $78,521 | $16,240 | $62,281 |
| 2014 | -- | $75,501 | $15,615 | $59,886 |
| 2013 | -- | $76,264 | $15,773 | $60,491 |
Source: Public Records
Map
Nearby Homes
- 22 Sherwick Rd
- 3 Orchard Rd
- 123 Orchard Rd
- 2 Orchard Rd
- 10 Crofton Rd
- 420 Chesterfield Ct Unit 420
- 4 Circle Ct
- 38 Ashlawn Ave
- 9 Cebold Dr
- 47 Old Post Rd
- 40 Codorus Rd
- 39 Cayman Dr
- 621 Mansfield Way
- 156 River Mist Dr
- 735 Alberta Ave
- 737 Alberta Ave
- 141 River Mist Dr
- 739 Alberta Ave
- 100 Piper Glen Ave
- 703 Pomfret Ct
- 447 Boulder Hill Pass
- 317 Lombardy Ln
- 315 Lombardy Ln
- 125 Nottingham Ct
- 445 Boulder Hill Pass Unit 3
- 313 Lombardy Ln
- 127 Nottingham Ct
- 443 Boulder Hill Pass Unit 3
- 311 Lombardy Ln
- 123 Nottingham Ct
- 714 Westpoint Way
- 716 Westpoint Way
- 724 Westpoint Way
- 733 Westpoint Way
- 441 Boulder Hill Pass
- 309 Lombardy Ln
- 129 Nottingham Ct
- 121 Nottingham Ct
- 119 Nottingham Dr
- 439 Boulder Hill Pass