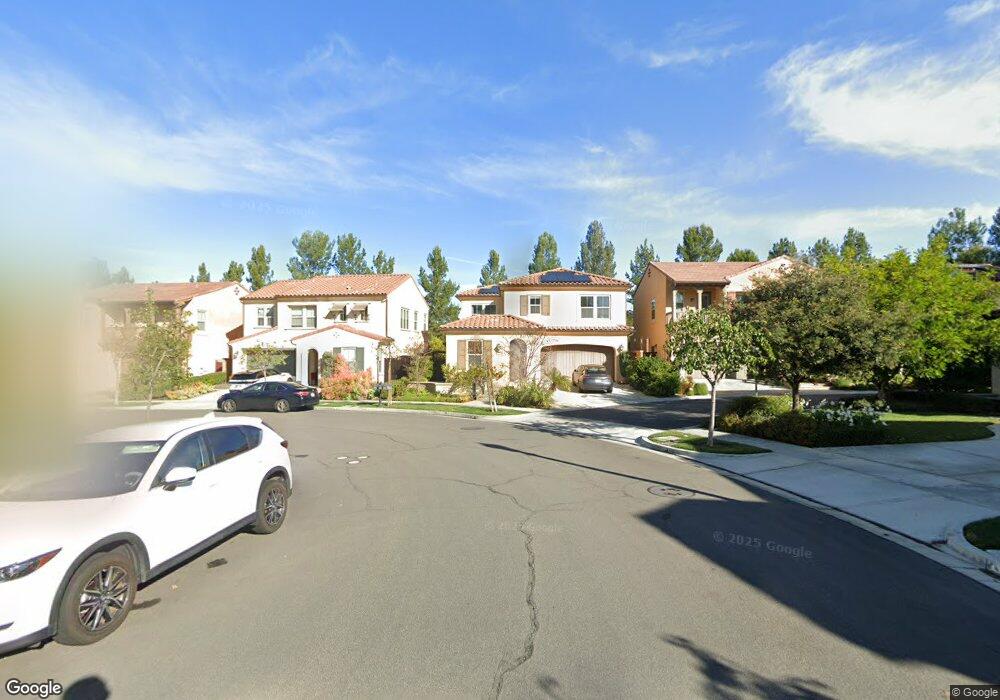
45 Los Indios Irvine, CA 92618
Portola Springs NeighborhoodEstimated Value: $1,668,347 - $1,870,000
3
Beds
3
Baths
1,953
Sq Ft
$911/Sq Ft
Est. Value
About This Home
This home is located at 45 Los Indios, Irvine, CA 92618 and is currently estimated at $1,780,087, approximately $911 per square foot. 45 Los Indios is a home with nearby schools including Portola Springs Elementary, Jeffrey Trail Middle, and Portola High School.
Ownership History
Date
Name
Owned For
Owner Type
Purchase Details
Closed on
Oct 1, 2012
Sold by
Exeter Fiduciary Services Llc
Bought by
Du Yi Min
Current Estimated Value
Home Financials for this Owner
Home Financials are based on the most recent Mortgage that was taken out on this home.
Original Mortgage
$507,981
Outstanding Balance
$351,595
Interest Rate
3.5%
Mortgage Type
New Conventional
Estimated Equity
$1,428,492
Create a Home Valuation Report for This Property
The Home Valuation Report is an in-depth analysis detailing your home's value as well as a comparison with similar homes in the area
Home Values in the Area
Average Home Value in this Area
Purchase History
| Date | Buyer | Sale Price | Title Company |
|---|---|---|---|
| Du Yi Min | $635,000 | First American Title Company |
Source: Public Records
Mortgage History
| Date | Status | Borrower | Loan Amount |
|---|---|---|---|
| Open | Du Yi Min | $507,981 |
Source: Public Records
Tax History
| Year | Tax Paid | Tax Assessment Tax Assessment Total Assessment is a certain percentage of the fair market value that is determined by local assessors to be the total taxable value of land and additions on the property. | Land | Improvement |
|---|---|---|---|---|
| 2025 | $11,748 | $781,923 | $408,098 | $373,825 |
| 2024 | $11,748 | $766,592 | $400,096 | $366,496 |
| 2023 | $12,107 | $751,561 | $392,251 | $359,310 |
| 2022 | $11,874 | $736,825 | $384,560 | $352,265 |
| 2021 | $11,729 | $722,378 | $377,020 | $345,358 |
| 2020 | $11,640 | $714,971 | $373,154 | $341,817 |
| 2019 | $11,564 | $700,952 | $365,837 | $335,115 |
| 2018 | $11,617 | $687,208 | $358,663 | $328,545 |
| 2017 | $11,475 | $673,734 | $351,631 | $322,103 |
| 2016 | $11,338 | $660,524 | $344,736 | $315,788 |
| 2015 | $11,237 | $650,603 | $339,558 | $311,045 |
| 2014 | $11,106 | $637,859 | $332,906 | $304,953 |
Source: Public Records
Map
Nearby Homes
Your Personal Tour Guide
Ask me questions while you tour the home.