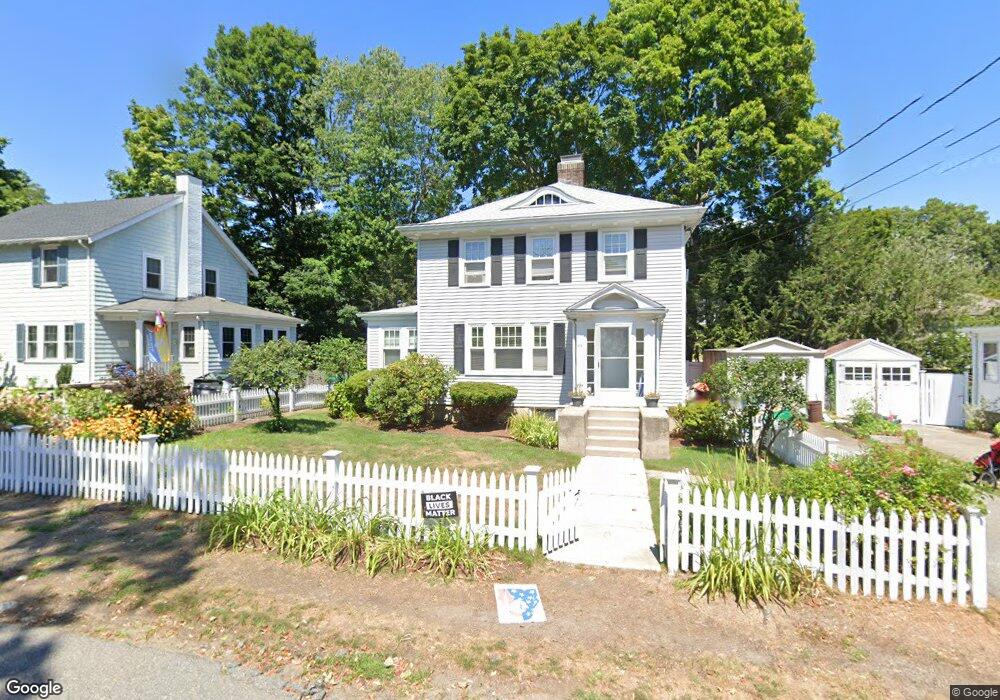
45 Wedgewood Rd West Newton, MA 02465
West Newton NeighborhoodEstimated Value: $1,118,000 - $1,324,146
3
Beds
4
Baths
1,620
Sq Ft
$764/Sq Ft
Est. Value
About This Home
This home is located at 45 Wedgewood Rd, West Newton, MA 02465 and is currently estimated at $1,237,787, approximately $764 per square foot. 45 Wedgewood Rd is a home located in Middlesex County with nearby schools including Franklin Elementary School, Horace Mann Elementary School, and F.A. Day Middle School.
Ownership History
Date
Name
Owned For
Owner Type
Purchase Details
Closed on
Oct 30, 1992
Sold by
Siciliano Nicholas J and Siciliano Sara O
Bought by
Korman Henry and Houston Elizabeth
Current Estimated Value
Home Financials for this Owner
Home Financials are based on the most recent Mortgage that was taken out on this home.
Original Mortgage
$199,200
Interest Rate
7.85%
Mortgage Type
Purchase Money Mortgage
Create a Home Valuation Report for This Property
The Home Valuation Report is an in-depth analysis detailing your home's value as well as a comparison with similar homes in the area
Home Values in the Area
Average Home Value in this Area
Purchase History
| Date | Buyer | Sale Price | Title Company |
|---|---|---|---|
| Korman Henry | $249,000 | -- |
Source: Public Records
Mortgage History
| Date | Status | Borrower | Loan Amount |
|---|---|---|---|
| Open | Korman Henry | $300,000 | |
| Closed | Korman Henry | $225,000 | |
| Closed | Korman Henry | $199,200 |
Source: Public Records
Tax History Compared to Growth
Tax History
| Year | Tax Paid | Tax Assessment Tax Assessment Total Assessment is a certain percentage of the fair market value that is determined by local assessors to be the total taxable value of land and additions on the property. | Land | Improvement |
|---|---|---|---|---|
| 2025 | $10,403 | $1,061,500 | $764,000 | $297,500 |
| 2024 | $10,059 | $1,030,600 | $741,700 | $288,900 |
| 2023 | $9,617 | $944,700 | $555,900 | $388,800 |
| 2022 | $9,202 | $874,700 | $514,700 | $360,000 |
| 2021 | $9,095 | $845,300 | $485,600 | $359,700 |
| 2020 | $8,825 | $845,300 | $485,600 | $359,700 |
| 2019 | $8,576 | $820,700 | $471,500 | $349,200 |
| 2018 | $8,177 | $755,700 | $427,600 | $328,100 |
| 2017 | $7,927 | $712,900 | $403,400 | $309,500 |
| 2016 | $7,582 | $666,300 | $377,000 | $289,300 |
| 2015 | $7,230 | $622,700 | $352,300 | $270,400 |
Source: Public Records
Map
Nearby Homes
- 27 Cross St Unit 27
- 4 Wiswall St
- 12 Wiswall St
- 321 Albemarle Rd
- 53-55 N Gate Park
- 41 Kilburn Rd
- 43 Walker St
- 287 Cherry St Unit 2
- 318 Austin St Unit A
- 123 Mount Vernon St Unit 2
- 371 Cherry St
- 354 Linwood Ave Unit 1
- 4 Hosmer Cir
- 429 Cherry St Unit 11
- 79 Chestnut St Unit 2
- 32-34 Rossmere St
- 611 Watertown St Unit 14
- 935 Washington St (Rear Facing) Unit 11
- 935 Washington St Unit 8
- 106 River St Unit 18