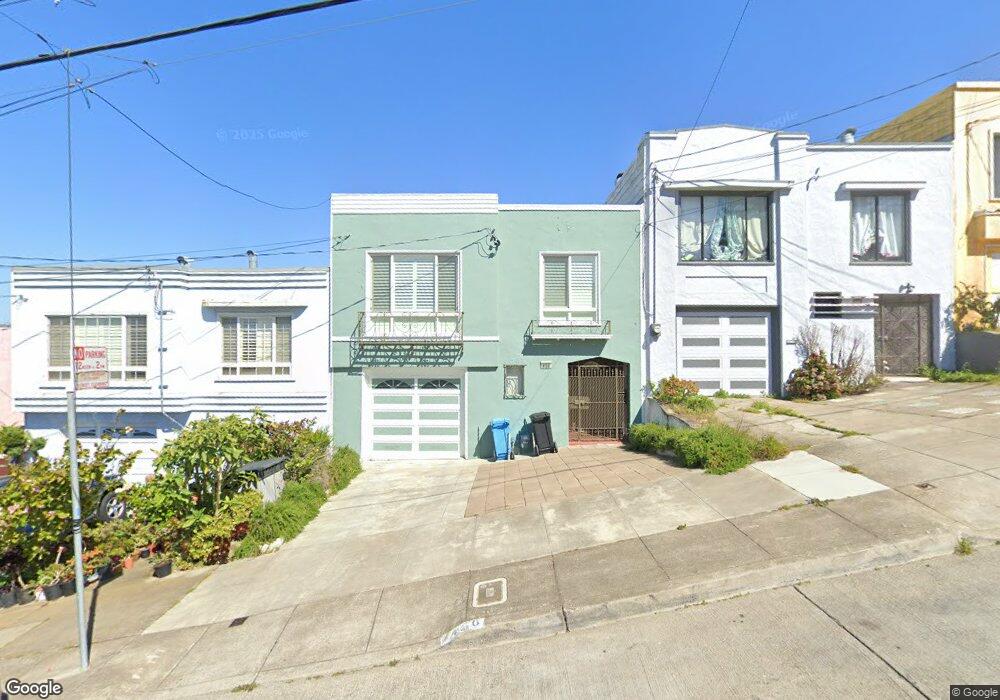
450 Arch St San Francisco, CA 94132
Merced Heights NeighborhoodEstimated Value: $872,927 - $1,380,000
2
Beds
1
Bath
925
Sq Ft
$1,153/Sq Ft
Est. Value
About This Home
This home is located at 450 Arch St, San Francisco, CA 94132 and is currently estimated at $1,066,482, approximately $1,152 per square foot. 450 Arch St is a home located in San Francisco County with nearby schools including Ortega (Jose) Elementary School, Aptos Middle School, and Krouzian-Zekarian-Vasbouragan Armenian School.
Ownership History
Date
Name
Owned For
Owner Type
Purchase Details
Closed on
Sep 15, 2000
Sold by
Lee Elaine L
Bought by
Wu Sean Xiao Kang and Wang Shen
Current Estimated Value
Home Financials for this Owner
Home Financials are based on the most recent Mortgage that was taken out on this home.
Original Mortgage
$252,700
Outstanding Balance
$91,317
Interest Rate
7.98%
Estimated Equity
$975,165
Create a Home Valuation Report for This Property
The Home Valuation Report is an in-depth analysis detailing your home's value as well as a comparison with similar homes in the area
Home Values in the Area
Average Home Value in this Area
Purchase History
| Date | Buyer | Sale Price | Title Company |
|---|---|---|---|
| Wu Sean Xiao Kang | $328,000 | Chicago Title Co |
Source: Public Records
Mortgage History
| Date | Status | Borrower | Loan Amount |
|---|---|---|---|
| Open | Wu Sean Xiao Kang | $252,700 |
Source: Public Records
Tax History Compared to Growth
Tax History
| Year | Tax Paid | Tax Assessment Tax Assessment Total Assessment is a certain percentage of the fair market value that is determined by local assessors to be the total taxable value of land and additions on the property. | Land | Improvement |
|---|---|---|---|---|
| 2025 | $6,383 | $494,221 | $296,535 | $197,686 |
| 2024 | $6,383 | $484,531 | $290,721 | $193,810 |
| 2023 | $6,278 | $475,031 | $285,021 | $190,010 |
| 2022 | $6,144 | $465,718 | $279,433 | $186,285 |
| 2021 | $6,030 | $456,587 | $273,954 | $182,633 |
| 2020 | $6,072 | $451,906 | $271,145 | $180,761 |
| 2019 | $5,866 | $443,046 | $265,829 | $177,217 |
| 2018 | $5,669 | $434,360 | $260,617 | $173,743 |
| 2017 | $5,302 | $425,844 | $255,507 | $170,337 |
| 2016 | $5,193 | $417,496 | $250,498 | $166,998 |
| 2015 | $5,126 | $411,226 | $246,736 | $164,490 |
| 2014 | $4,990 | $403,171 | $241,903 | $161,268 |
Source: Public Records
Map
Nearby Homes