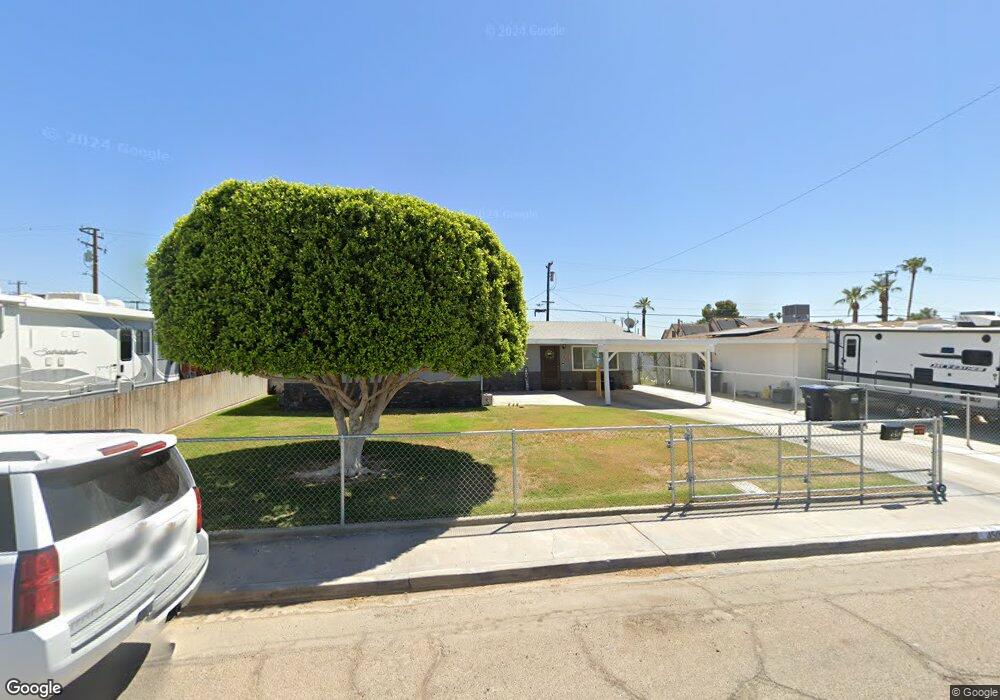
450 N 9th St Blythe, CA 92225
Estimated Value: $245,000 - $269,000
3
Beds
2
Baths
1,738
Sq Ft
$148/Sq Ft
Est. Value
About This Home
This home is located at 450 N 9th St, Blythe, CA 92225 and is currently estimated at $257,053, approximately $147 per square foot. 450 N 9th St is a home located in Riverside County with nearby schools including Palo Verde High School and Scale Leadership Academy - East.
Ownership History
Date
Name
Owned For
Owner Type
Purchase Details
Closed on
Jan 28, 2020
Sold by
Guerra Fernando C and Guerra Manuela M
Bought by
Shipley Tracy Rose
Current Estimated Value
Home Financials for this Owner
Home Financials are based on the most recent Mortgage that was taken out on this home.
Original Mortgage
$174,600
Outstanding Balance
$154,596
Interest Rate
3.6%
Mortgage Type
New Conventional
Estimated Equity
$102,457
Purchase Details
Closed on
Apr 20, 2018
Sold by
Grudovich Paul
Bought by
Grudovich Sandra
Purchase Details
Closed on
Dec 21, 1994
Sold by
Ybarra Teresa
Bought by
Ybarra Teresa and Ybarra Frances
Create a Home Valuation Report for This Property
The Home Valuation Report is an in-depth analysis detailing your home's value as well as a comparison with similar homes in the area
Home Values in the Area
Average Home Value in this Area
Purchase History
| Date | Buyer | Sale Price | Title Company |
|---|---|---|---|
| Shipley Tracy Rose | $180,000 | Stewart Title | |
| Grudovich Sandra | -- | Corinthian Title Company | |
| Baldwin Frances | -- | Corinthian Title Company | |
| Ybarra Teresa | -- | -- |
Source: Public Records
Mortgage History
| Date | Status | Borrower | Loan Amount |
|---|---|---|---|
| Open | Shipley Tracy Rose | $174,600 |
Source: Public Records
Tax History Compared to Growth
Tax History
| Year | Tax Paid | Tax Assessment Tax Assessment Total Assessment is a certain percentage of the fair market value that is determined by local assessors to be the total taxable value of land and additions on the property. | Land | Improvement |
|---|---|---|---|---|
| 2025 | $2,161 | $196,851 | $49,213 | $147,638 |
| 2023 | $2,161 | $189,209 | $47,303 | $141,906 |
| 2022 | $2,075 | $185,500 | $46,376 | $139,124 |
| 2021 | $2,021 | $181,864 | $45,467 | $136,397 |
| 2020 | $1,691 | $151,897 | $37,974 | $113,923 |
| 2019 | $1,677 | $148,920 | $37,230 | $111,690 |
| 2018 | $630 | $64,396 | $9,407 | $54,989 |
| 2017 | $615 | $63,134 | $9,223 | $53,911 |
| 2016 | $608 | $61,897 | $9,043 | $52,854 |
| 2015 | $601 | $60,969 | $8,908 | $52,061 |
| 2014 | $577 | $59,778 | $8,735 | $51,043 |
Source: Public Records
Map
Nearby Homes