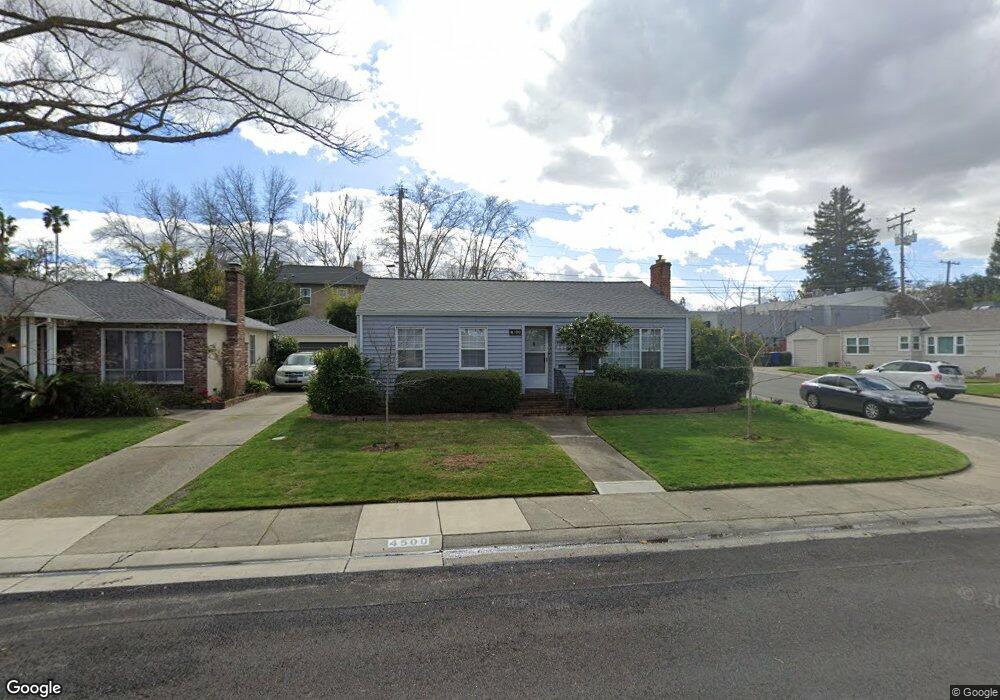
4500 C St Sacramento, CA 95819
East Sacramento NeighborhoodEstimated Value: $741,767 - $918,000
3
Beds
2
Baths
1,958
Sq Ft
$423/Sq Ft
Est. Value
About This Home
This home is located at 4500 C St, Sacramento, CA 95819 and is currently estimated at $828,942, approximately $423 per square foot. 4500 C St is a home located in Sacramento County with nearby schools including Theodore Judah Elementary, Miwok Middle School, and Hiram W. Johnson High School.
Ownership History
Date
Name
Owned For
Owner Type
Purchase Details
Closed on
Oct 23, 2019
Sold by
Walthall Maureen Cathy
Bought by
Walthall Maureen and The Maureen Walthall 2019 Livi
Current Estimated Value
Purchase Details
Closed on
Sep 12, 2019
Sold by
Lau Leilani Camille
Bought by
Lau Leilani C and The Lellani C Lau 2010 Trust
Purchase Details
Closed on
Mar 3, 2018
Sold by
Krieger Suzanne Robyn
Bought by
Lau Denise
Purchase Details
Closed on
Sep 19, 2017
Sold by
Walthall Maureen Cathy and The Jeanette Rae Lau Family Tr
Bought by
Lau Leilani Camille and Walthall Maureen Cathy
Purchase Details
Closed on
Sep 18, 2017
Sold by
Lau Leilani and The Robert K Lau 1999 Family T
Bought by
Lau Leilani Camille and Walthall Maureen Cathy
Purchase Details
Closed on
Aug 23, 2013
Sold by
Lau Jeanette Rae
Bought by
Lau Jeanette Rae
Purchase Details
Closed on
May 13, 1999
Sold by
Lau Robert K
Bought by
Lau Robert K and Robert K Lau 1999 Family Trust
Create a Home Valuation Report for This Property
The Home Valuation Report is an in-depth analysis detailing your home's value as well as a comparison with similar homes in the area
Home Values in the Area
Average Home Value in this Area
Purchase History
| Date | Buyer | Sale Price | Title Company |
|---|---|---|---|
| Walthall Maureen | -- | None Available | |
| Lau Leilani C | -- | None Available | |
| Lau Denise | $65,500 | None Available | |
| Lau Leilani Camille | -- | None Available | |
| Lau Leilani Camille | -- | None Available | |
| Lau Jeanette Rae | -- | None Available | |
| Lau Robert K | -- | -- |
Source: Public Records
Tax History
| Year | Tax Paid | Tax Assessment Tax Assessment Total Assessment is a certain percentage of the fair market value that is determined by local assessors to be the total taxable value of land and additions on the property. | Land | Improvement |
|---|---|---|---|---|
| 2025 | $2,016 | $155,120 | $69,596 | $85,524 |
| 2024 | $2,016 | $152,080 | $68,232 | $83,848 |
| 2023 | $1,970 | $149,099 | $66,895 | $82,204 |
| 2022 | $1,937 | $146,177 | $65,584 | $80,593 |
| 2021 | $1,850 | $143,312 | $64,299 | $79,013 |
| 2020 | $1,861 | $141,843 | $63,640 | $78,203 |
| 2019 | $1,823 | $139,063 | $62,393 | $76,670 |
| 2018 | $1,110 | $132,962 | $57,420 | $75,542 |
| 2017 | $1,016 | $75,742 | $15,323 | $60,419 |
| 2016 | $959 | $74,258 | $15,023 | $59,235 |
| 2015 | $931 | $73,144 | $14,798 | $58,346 |
| 2014 | $909 | $71,715 | $14,510 | $57,205 |
Source: Public Records
Map
Nearby Homes
Your Personal Tour Guide
Ask me questions while you tour the home.