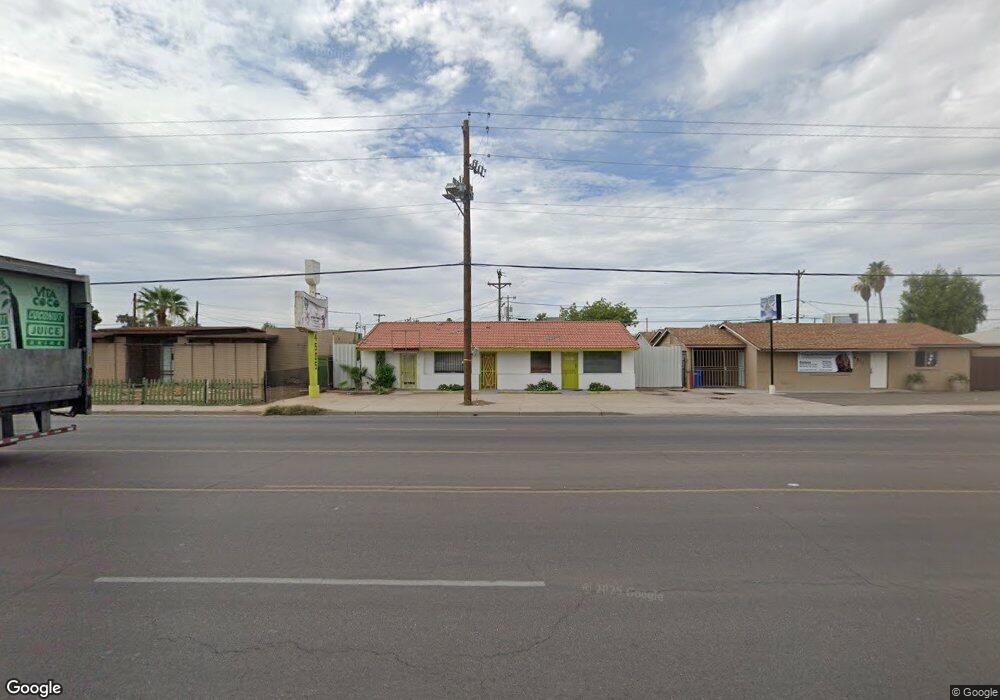
4505 W Indian School Rd Phoenix, AZ 85031
Maryvale NeighborhoodEstimated Value: $287,631
--
Bed
--
Bath
1,846
Sq Ft
$156/Sq Ft
Est. Value
About This Home
This home is located at 4505 W Indian School Rd, Phoenix, AZ 85031 and is currently estimated at $287,631, approximately $155 per square foot. 4505 W Indian School Rd is a home located in Maricopa County with nearby schools including Glenn L. Downs Social Sciences Academy, Justine Spitalny School, and Maryvale High School.
Ownership History
Date
Name
Owned For
Owner Type
Purchase Details
Closed on
May 31, 2006
Sold by
Nunez Hector M
Bought by
Spohnhotz Silvia
Current Estimated Value
Home Financials for this Owner
Home Financials are based on the most recent Mortgage that was taken out on this home.
Original Mortgage
$156,500
Outstanding Balance
$92,318
Interest Rate
6.63%
Mortgage Type
Commercial
Estimated Equity
$196,662
Purchase Details
Closed on
Dec 14, 2004
Sold by
Spohnholz Conrad
Bought by
Spohnholz Silvia
Purchase Details
Closed on
Aug 2, 2000
Sold by
Nunez Edith
Bought by
Nunez Hector M
Purchase Details
Closed on
Nov 16, 1998
Sold by
Nunez Edith
Bought by
Nunez Hector
Purchase Details
Closed on
Nov 9, 1998
Sold by
Glass Richard and Glass Barbara L
Bought by
Nunez Hector
Purchase Details
Closed on
Jan 26, 1996
Sold by
Stanton Eva L
Bought by
Glass Richard and Glass Barbara L
Create a Home Valuation Report for This Property
The Home Valuation Report is an in-depth analysis detailing your home's value as well as a comparison with similar homes in the area
Home Values in the Area
Average Home Value in this Area
Purchase History
| Date | Buyer | Sale Price | Title Company |
|---|---|---|---|
| Spohnhotz Silvia | -- | Fidelity National Title | |
| Spohnholz Silvia | -- | First American Title Ins Co | |
| Nunez Hector M | -- | -- | |
| Nunez Hector | -- | Fidelity Title | |
| Nunez Hector | $76,214 | Fidelity Title | |
| Glass Richard | -- | Chicago Title Insurance Co |
Source: Public Records
Mortgage History
| Date | Status | Borrower | Loan Amount |
|---|---|---|---|
| Open | Spohnhotz Silvia | $156,500 |
Source: Public Records
Tax History Compared to Growth
Tax History
| Year | Tax Paid | Tax Assessment Tax Assessment Total Assessment is a certain percentage of the fair market value that is determined by local assessors to be the total taxable value of land and additions on the property. | Land | Improvement |
|---|---|---|---|---|
| 2025 | $3,016 | $17,227 | -- | -- |
| 2024 | $3,185 | $16,919 | -- | -- |
| 2023 | $3,185 | $25,942 | $11,288 | $14,654 |
| 2022 | $3,092 | $22,680 | $9,205 | $13,475 |
| 2021 | $3,220 | $22,968 | $9,468 | $13,500 |
| 2020 | $3,051 | $21,168 | $7,794 | $13,374 |
| 2019 | $2,920 | $18,810 | $6,138 | $12,672 |
| 2018 | $3,036 | $18,504 | $5,688 | $12,816 |
| 2017 | $2,937 | $14,076 | $5,922 | $8,154 |
| 2016 | $2,809 | $13,140 | $5,526 | $7,614 |
| 2015 | $2,693 | $12,229 | $5,643 | $6,586 |
Source: Public Records
Map
Nearby Homes
- 4536 W Fairmount Ave
- 4450 W Weldon Ave
- 3840 N 43rd Ave Unit 79
- 3840 N 43rd Ave Unit 36
- 3840 N 43rd Ave Unit 73
- 3840 N 43rd Ave Unit 29
- 3840 N 43rd Ave Unit 58
- 4414 W Weldon Ave
- 4634 W Weldon Ave
- 4502 W Crittenden Ln
- 4146 N 48th Dr
- 3628 N 49th Ave
- 4315 W Osborn Rd
- 4733 W Crittenden Ln
- 4915 W Montecito Ave
- 4407 W Monterey Way
- 4306 N 50th Ave
- 4420 W Earll Dr
- 4460 W Avalon Dr
- 4239 N 40th Ave
- 4511 W Indian School Rd
- 4501 W Indian School Rd
- 4026 N 45th Ave
- 4516 W Fairmount Ave Unit 1
- 4022 N 45th Ave
- 4521 W Indian School Rd
- 4015 N 45th Dr
- 4522 W Fairmount Ave
- 4016 N 45th Ave
- 4525 W Indian School Rd
- 4009 N 45th Dr
- 4526 W Fairmount Ave
- 4010 N 45th Ave
- 4531 W Indian School Rd
- 4532 W Fairmount Ave
- 4521 W Fairmount Ave
- 4508 W Indianola Ave
- 4502 W Indianola Ave
- 4514 W Indianola Ave Unit 1
- 4535 W Indian School Rd