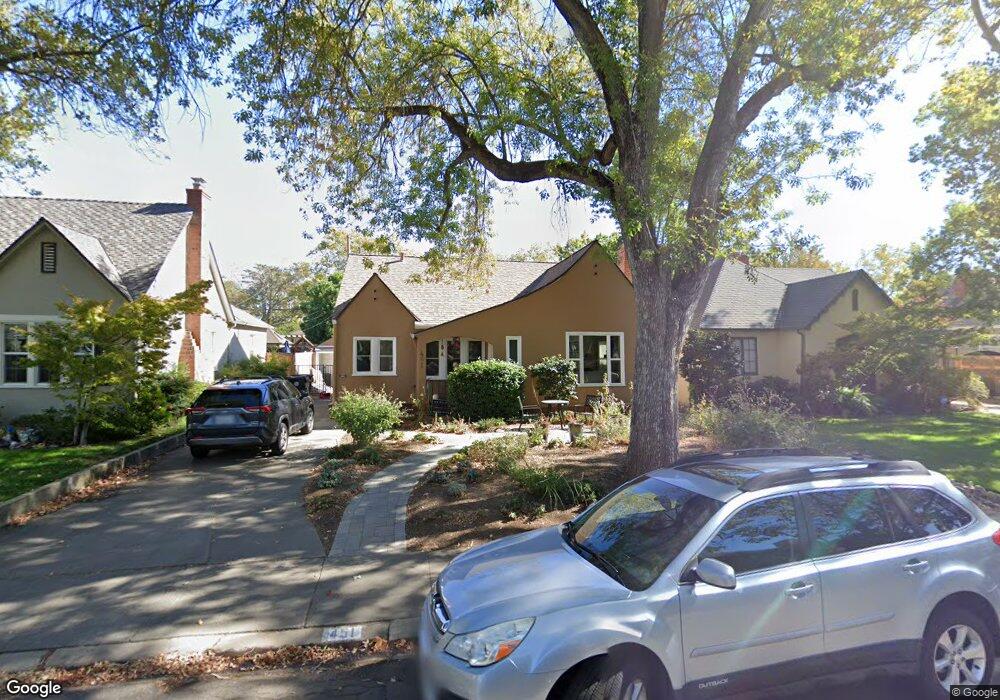
451 45th St Sacramento, CA 95819
East Sacramento NeighborhoodEstimated Value: $579,000 - $934,000
3
Beds
2
Baths
1,946
Sq Ft
$411/Sq Ft
Est. Value
About This Home
This home is located at 451 45th St, Sacramento, CA 95819 and is currently estimated at $800,306, approximately $411 per square foot. 451 45th St is a home located in Sacramento County with nearby schools including Theodore Judah Elementary, Miwok Middle School, and Hiram W. Johnson High School.
Ownership History
Date
Name
Owned For
Owner Type
Purchase Details
Closed on
Mar 20, 2012
Sold by
Paris Salb Jonn M and Paris Salb Randi
Bought by
Paris Salb Jonn M and Paris Salb Randi
Current Estimated Value
Purchase Details
Closed on
Aug 24, 1994
Sold by
West Scott H and West Theresa A
Bought by
Paris Salb John and Paris Salb Randi
Home Financials for this Owner
Home Financials are based on the most recent Mortgage that was taken out on this home.
Original Mortgage
$165,000
Interest Rate
8.57%
Create a Home Valuation Report for This Property
The Home Valuation Report is an in-depth analysis detailing your home's value as well as a comparison with similar homes in the area
Home Values in the Area
Average Home Value in this Area
Purchase History
| Date | Buyer | Sale Price | Title Company |
|---|---|---|---|
| Paris Salb Jonn M | -- | None Available | |
| Paris Salb Jonn M | -- | None Available | |
| Paris Salb John | $227,500 | Chicago Title Company |
Source: Public Records
Mortgage History
| Date | Status | Borrower | Loan Amount |
|---|---|---|---|
| Closed | Paris Salb John | $165,000 | |
| Closed | Paris Salb John | $10,000 |
Source: Public Records
Tax History Compared to Growth
Tax History
| Year | Tax Paid | Tax Assessment Tax Assessment Total Assessment is a certain percentage of the fair market value that is determined by local assessors to be the total taxable value of land and additions on the property. | Land | Improvement |
|---|---|---|---|---|
| 2025 | $4,589 | $382,101 | $125,962 | $256,139 |
| 2024 | $4,589 | $374,610 | $123,493 | $251,117 |
| 2023 | $4,481 | $367,266 | $121,072 | $246,194 |
| 2022 | $4,406 | $360,066 | $118,699 | $241,367 |
| 2021 | $4,200 | $353,007 | $116,372 | $236,635 |
| 2020 | $4,234 | $349,388 | $115,179 | $234,209 |
| 2019 | $4,145 | $342,538 | $112,921 | $229,617 |
| 2018 | $4,038 | $335,822 | $110,707 | $225,115 |
| 2017 | $3,983 | $329,238 | $108,537 | $220,701 |
| 2016 | $3,881 | $322,783 | $106,409 | $216,374 |
| 2015 | $3,820 | $317,935 | $104,811 | $213,124 |
| 2014 | $3,717 | $311,708 | $102,758 | $208,950 |
Source: Public Records
Map
Nearby Homes