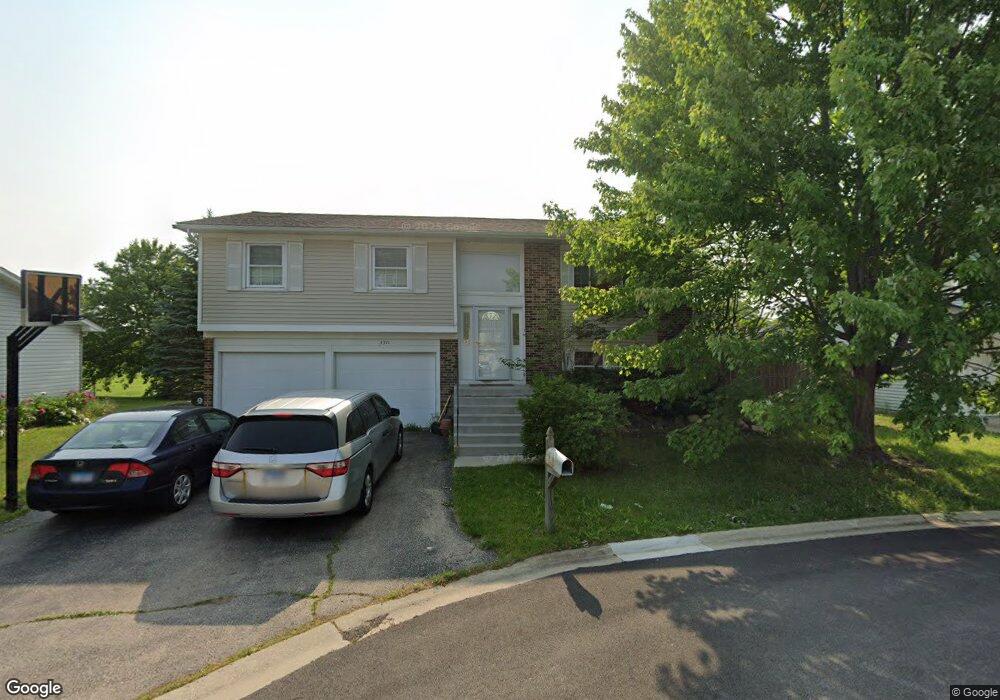
4511 Bicek Ct Hoffman Estates, IL 60192
South Ridge NeighborhoodEstimated Value: $393,000 - $424,984
3
Beds
2
Baths
1,176
Sq Ft
$348/Sq Ft
Est. Value
About This Home
This home is located at 4511 Bicek Ct, Hoffman Estates, IL 60192 and is currently estimated at $409,746, approximately $348 per square foot. 4511 Bicek Ct is a home located in Cook County with nearby schools including Thomas Jefferson Elementary School, Frank C. Whiteley Elementary School, and William Fremd High School.
Ownership History
Date
Name
Owned For
Owner Type
Purchase Details
Closed on
Aug 29, 2007
Sold by
Reeves Sherry and Dworkin Sherry D
Bought by
Kim Whun and Arias Bernardo
Current Estimated Value
Home Financials for this Owner
Home Financials are based on the most recent Mortgage that was taken out on this home.
Original Mortgage
$220,000
Outstanding Balance
$137,146
Interest Rate
6.63%
Mortgage Type
Unknown
Estimated Equity
$272,600
Purchase Details
Closed on
Aug 31, 1999
Sold by
Dworkin Edward S
Bought by
Dworkin Sherry D
Purchase Details
Closed on
Dec 17, 1993
Sold by
Gutknecht Susan A and Gutknecht William E
Bought by
Dworkin Edward S and Dworkin Sherry D
Home Financials for this Owner
Home Financials are based on the most recent Mortgage that was taken out on this home.
Original Mortgage
$140,800
Interest Rate
7.16%
Mortgage Type
FHA
Create a Home Valuation Report for This Property
The Home Valuation Report is an in-depth analysis detailing your home's value as well as a comparison with similar homes in the area
Home Values in the Area
Average Home Value in this Area
Purchase History
| Date | Buyer | Sale Price | Title Company |
|---|---|---|---|
| Kim Whun | $320,000 | Pntn | |
| Dworkin Sherry D | -- | -- | |
| Dworkin Edward S | $96,000 | -- |
Source: Public Records
Mortgage History
| Date | Status | Borrower | Loan Amount |
|---|---|---|---|
| Open | Kim Whun | $220,000 | |
| Previous Owner | Dworkin Edward S | $140,800 |
Source: Public Records
Tax History
| Year | Tax Paid | Tax Assessment Tax Assessment Total Assessment is a certain percentage of the fair market value that is determined by local assessors to be the total taxable value of land and additions on the property. | Land | Improvement |
|---|---|---|---|---|
| 2025 | $8,277 | $34,032 | $4,564 | $29,468 |
| 2024 | $8,277 | $30,313 | $3,912 | $26,401 |
| 2023 | $7,969 | $30,313 | $3,912 | $26,401 |
| 2022 | $7,969 | $30,313 | $3,912 | $26,401 |
| 2021 | $7,021 | $24,297 | $2,716 | $21,581 |
| 2020 | $6,941 | $24,297 | $2,716 | $21,581 |
| 2019 | $6,871 | $26,937 | $2,716 | $24,221 |
| 2018 | $7,427 | $26,877 | $2,499 | $24,378 |
| 2017 | $7,307 | $26,877 | $2,499 | $24,378 |
| 2016 | $7,035 | $26,877 | $2,499 | $24,378 |
| 2015 | $6,307 | $22,916 | $2,282 | $20,634 |
| 2014 | $6,205 | $22,916 | $2,282 | $20,634 |
| 2013 | $6,030 | $22,916 | $2,282 | $20,634 |
Source: Public Records
Map
Nearby Homes
- 1690 Cape Breton Ct
- 1478 W Sapphire Dr
- 4490 Capstan Dr
- 1280 Clover Ln
- 4950 Tarrington Dr
- 4480 Thornbark Dr
- 1213 Silver Pine Dr
- 4990 Rochester Dr
- 61 E Rd
- 61 E Rd
- 61 E Palatine #4 Rd
- 61 E Palatine Rd
- 1030 Ridgeview Dr
- 4100 N Victoria Dr
- 3830 Anjou Ln
- 3881 Bordeaux Dr
- 5190 Chambers Dr
- 2204 Shetland Rd
- 1120 Ashley Ln
- 1115 Ashley Ln
- 4521 Bicek Ct
- 4501 Bicek Ct
- 4491 Bicek Ct
- 4531 Bicek Ct Unit 4
- 4520 Bicek Ct
- 4471 Bayside Cir
- 4481 Bayside Cir
- 4475 Bayside Cir
- 4510 Bicek Ct
- 4490 Bicek Ct
- 4500 Bicek Ct
- 4530 Bicek Ct
- 4541 Bicek Ct
- 4485 Bayside Cir
- 4465 Bayside Cir
- 1659 Dover Ct
- 1660 Cape Breton Ct
- 4540 Bicek Ct
- 1669 Dover Ct
- 1660 Dover Ct
Your Personal Tour Guide
Ask me questions while you tour the home.