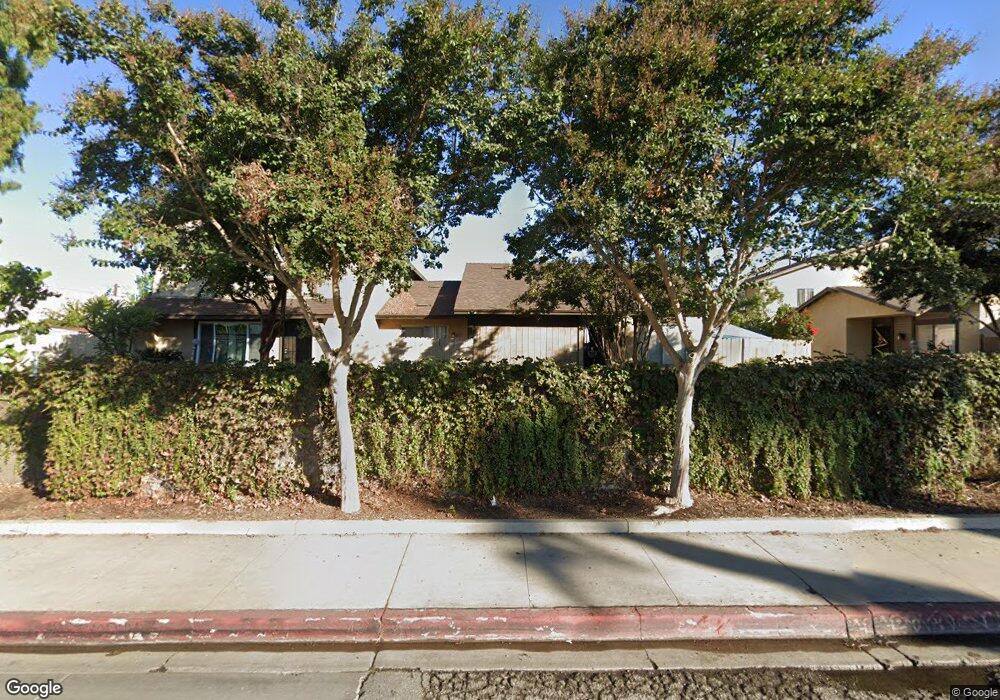
4523 Bodega Ct Montclair, CA 91763
Estimated Value: $381,513 - $426,000
2
Beds
1
Bath
977
Sq Ft
$414/Sq Ft
Est. Value
About This Home
This home is located at 4523 Bodega Ct, Montclair, CA 91763 and is currently estimated at $404,628, approximately $414 per square foot. 4523 Bodega Ct is a home located in San Bernardino County with nearby schools including Montera Elementary School, Serrano Middle School, and Montclair High School.
Ownership History
Date
Name
Owned For
Owner Type
Purchase Details
Closed on
Jul 6, 2019
Sold by
Oso Malcolm and Oso Josephine Diane
Bought by
Oso Malcolm and Oso Josephine Diane
Current Estimated Value
Purchase Details
Closed on
Nov 23, 1998
Sold by
Oso Malcolm and Oso Mark D
Bought by
Oso Malcolm and Oso Josephine Diane
Home Financials for this Owner
Home Financials are based on the most recent Mortgage that was taken out on this home.
Original Mortgage
$57,750
Interest Rate
6.63%
Mortgage Type
FHA
Create a Home Valuation Report for This Property
The Home Valuation Report is an in-depth analysis detailing your home's value as well as a comparison with similar homes in the area
Home Values in the Area
Average Home Value in this Area
Purchase History
| Date | Buyer | Sale Price | Title Company |
|---|---|---|---|
| Oso Malcolm | -- | None Available | |
| Oso Malcolm | -- | United Title Company |
Source: Public Records
Mortgage History
| Date | Status | Borrower | Loan Amount |
|---|---|---|---|
| Closed | Oso Malcolm | $57,750 |
Source: Public Records
Tax History
| Year | Tax Paid | Tax Assessment Tax Assessment Total Assessment is a certain percentage of the fair market value that is determined by local assessors to be the total taxable value of land and additions on the property. | Land | Improvement |
|---|---|---|---|---|
| 2025 | $1,537 | $138,868 | $46,915 | $91,953 |
| 2024 | $1,503 | $136,145 | $45,995 | $90,150 |
| 2023 | $1,461 | $133,475 | $45,093 | $88,382 |
| 2022 | $1,441 | $130,858 | $44,209 | $86,649 |
| 2021 | $1,432 | $128,292 | $43,342 | $84,950 |
| 2020 | $1,407 | $126,977 | $42,898 | $84,079 |
| 2019 | $1,395 | $124,487 | $42,057 | $82,430 |
| 2018 | $1,376 | $122,046 | $41,232 | $80,814 |
| 2017 | $1,327 | $119,653 | $40,424 | $79,229 |
| 2016 | $1,275 | $117,306 | $39,631 | $77,675 |
| 2015 | $1,266 | $115,544 | $39,036 | $76,508 |
| 2014 | $1,227 | $113,280 | $38,271 | $75,009 |
Source: Public Records
Map
Nearby Homes
- 4543 Bodega Ct Unit 90
- 4512 Donner Ct
- 4545 Canoga St
- 4790 Brooks St
- 4902 Manzanita St
- 4903 Bandera St
- 4762 W Mission Blvd Unit 25
- 4256 Fauna St
- 10593 Mills Ave
- 10163 Oak Glen Ave
- 11000 Kimberly Ave
- 4444 Merle St
- 4175 Rudisill St
- 1667 E Kingsley Ave
- 4361 Mission Blvd Unit 80
- 1751 E Jefferson Ave
- 1408 Baldy View Ave
- 10995 Coalinga Ave
- 1710 E Mckinley Ave
- 1841 Fellows Place
- 4527 Bodega Ct Unit 81
- 4521 Bodega Ct Unit 84
- 4525 Bodega Ct
- 4535 Bodega Ct
- 4531 Bodega Ct
- 4537 Bodega Ct Unit 87
- 4533 Bodega Ct
- 4533 Holt Blvd Unit 88
- 4533 Holt Blvd
- 4532 Bodega Ct
- 4536 Bodega Ct Unit 77
- 4545 Bodega Ct
- 4541 Bodega Ct Unit 89
- 4541 Bodega Ct
- 4534 Bodega Ct Unit 80
- 4534 Bodega Ct
- 4538 Bodega Ct
- 10486 Calico Ct
- 4547 Bodega Ct
Your Personal Tour Guide
Ask me questions while you tour the home.