Estimated Value: $599,000 - $775,000
4
Beds
2
Baths
2,555
Sq Ft
$276/Sq Ft
Est. Value
About This Home
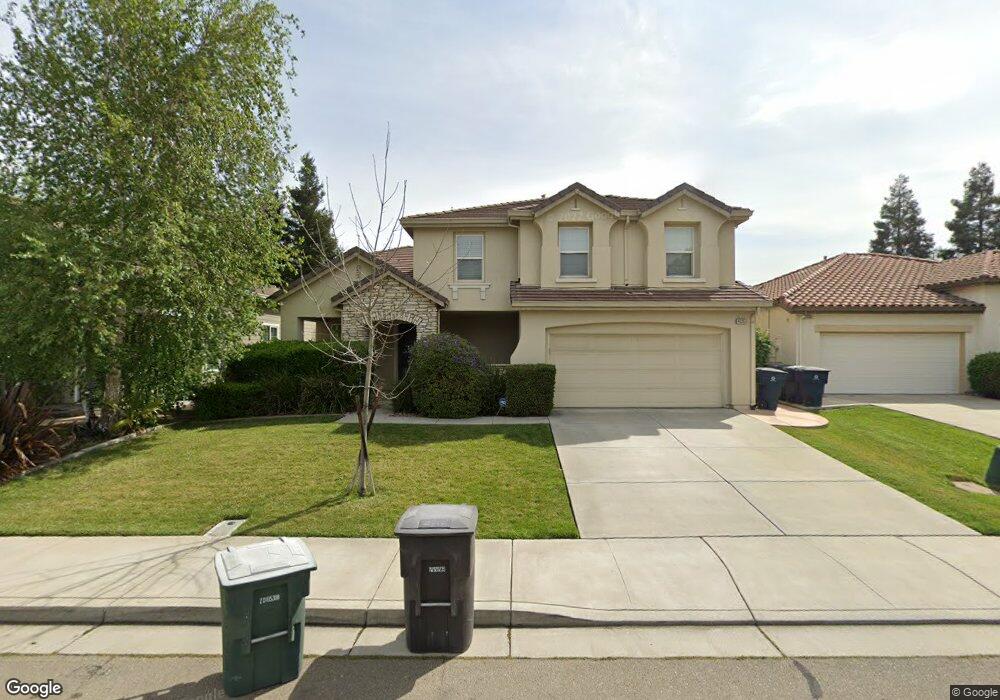
This home is located at 4526 Dandelion Loop, Tracy, CA 95377 and is currently estimated at $704,223, approximately $275 per square foot. 4526 Dandelion Loop is a home located in San Joaquin County with nearby schools including Monticello Elementary School, Jefferson, and Tracy High School.
Ownership History
Date
Name
Owned For
Owner Type
Purchase Details
Closed on
Sep 21, 2013
Sold by
Gupta Maheshchandra M and Gupta Sangeeta M
Bought by
Gupta Maheshchandra M and Gupta Sangeeta M
Current Estimated Value
Purchase Details
Closed on
Jul 28, 2010
Sold by
Amith Richard Q and Amith Jeny N
Bought by
Gupta Maheshchandra and Gupta Sangeeta
Home Financials for this Owner
Home Financials are based on the most recent Mortgage that was taken out on this home.
Original Mortgage
$153,000
Outstanding Balance
$102,014
Interest Rate
4.71%
Mortgage Type
New Conventional
Estimated Equity
$602,209
Purchase Details
Closed on
Oct 6, 2003
Sold by
Shea Homes Lp
Bought by
Amith Richard Q and Amith Jeny N
Home Financials for this Owner
Home Financials are based on the most recent Mortgage that was taken out on this home.
Original Mortgage
$303,500
Interest Rate
4.87%
Mortgage Type
Purchase Money Mortgage
Create a Home Valuation Report for This Property
The Home Valuation Report is an in-depth analysis detailing your home's value as well as a comparison with similar homes in the area
Home Values in the Area
Average Home Value in this Area
Purchase History
| Date | Buyer | Sale Price | Title Company |
|---|---|---|---|
| Gupta Maheshchandra M | -- | None Available | |
| Gupta Maheshchandra | $255,000 | Chicago Title Company | |
| Amith Richard Q | $379,500 | First Amer Title Co |
Source: Public Records
Mortgage History
| Date | Status | Borrower | Loan Amount |
|---|---|---|---|
| Open | Gupta Maheshchandra | $153,000 | |
| Previous Owner | Amith Richard Q | $303,500 | |
| Closed | Amith Richard Q | $56,900 |
Source: Public Records
Tax History
| Year | Tax Paid | Tax Assessment Tax Assessment Total Assessment is a certain percentage of the fair market value that is determined by local assessors to be the total taxable value of land and additions on the property. | Land | Improvement |
|---|---|---|---|---|
| 2025 | $3,724 | $326,687 | $80,709 | $245,978 |
| 2024 | $3,610 | $320,282 | $79,127 | $241,155 |
| 2023 | $3,544 | $314,003 | $77,576 | $236,427 |
| 2022 | $3,479 | $307,847 | $76,055 | $231,792 |
| 2021 | $3,425 | $301,812 | $74,564 | $227,248 |
| 2020 | $3,398 | $298,718 | $73,800 | $224,918 |
| 2019 | $3,293 | $292,861 | $72,353 | $220,508 |
| 2018 | $3,285 | $287,120 | $70,935 | $216,185 |
| 2017 | $3,206 | $281,492 | $69,545 | $211,947 |
| 2016 | $3,146 | $275,974 | $68,182 | $207,792 |
| 2014 | $3,065 | $266,506 | $65,843 | $200,663 |
Source: Public Records
Map
Nearby Homes
- 4484 Lindsey Ln
- 4597 Bonsai Ave
- 4526 Oakridge Dr
- 297 Brookview Dr
- 252 Lasata Dr
- 443 Glenbriar Cir
- 396 Glenbriar Cir
- 426 Darlene Ln
- 827 Sagewood Ln
- 8834 Waterwell Way
- 482 Quail Run Cir
- 710 Potsgrove Place
- 2861 Pebblebrooke Ct
- 715 Cambridge Ct
- 2851 Pebblebrooke Ct
- 544 Glenbriar Cir
- 8485 Ranch Rd
- 1531 Riverview Ave
- 8324 Waterwell Way
- 4699 Poppy Hills Ln
- 4546 Dandelion Loop
- 4516 Dandelion Loop
- 4566 Dandelion Loop
- 4521 Glenhaven Dr
- 4506 Dandelion Loop
- 4541 Glenhaven Dr
- 4501 Glenhaven Dr
- 4561 Glenhaven Dr
- 60 Wisteria Ln
- 4481 Glenhaven Dr
- 4525 Dandelion Loop
- 4586 Dandelion Loop
- 4545 Dandelion Loop
- 4581 Glenhaven Dr
- 4565 Dandelion Loop
- 4461 Glenhaven Dr
- 4601 Glenhaven Dr
- 70 Wisteria Ln
- 4606 Dandelion Loop
- 4585 Dandelion Loop
Your Personal Tour Guide
Ask me questions while you tour the home.