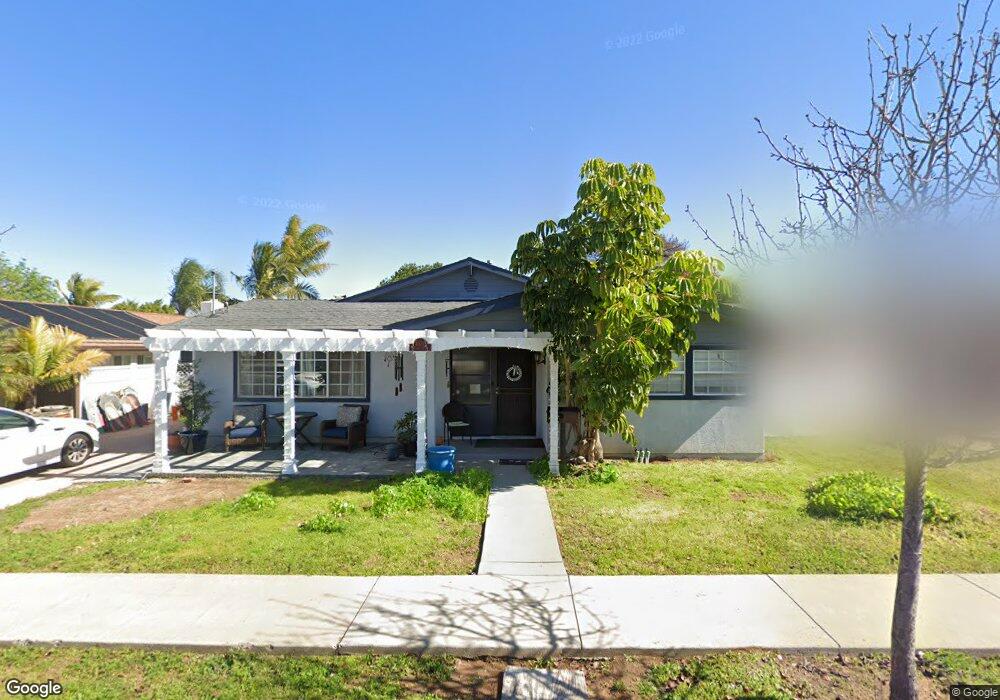
4529 La Crosse Ave San Diego, CA 92117
Bay Ho NeighborhoodEstimated Value: $1,256,000 - $1,393,000
3
Beds
3
Baths
1,564
Sq Ft
$845/Sq Ft
Est. Value
About This Home
This home is located at 4529 La Crosse Ave, San Diego, CA 92117 and is currently estimated at $1,322,177, approximately $845 per square foot. 4529 La Crosse Ave is a home located in San Diego County with nearby schools including Cadman Elementary School, Marston Middle School, and Clairemont High School.
Ownership History
Date
Name
Owned For
Owner Type
Purchase Details
Closed on
Aug 15, 2024
Sold by
Cabral Dana and Cabral Michael
Bought by
Cabral 2024 Trust and Cabral
Current Estimated Value
Purchase Details
Closed on
Aug 28, 2002
Sold by
Cabral Michael and Cabral Dana Sue
Bought by
Cabral Michael and Cabral Dana
Home Financials for this Owner
Home Financials are based on the most recent Mortgage that was taken out on this home.
Original Mortgage
$270,000
Interest Rate
6.29%
Purchase Details
Closed on
Dec 15, 1987
Create a Home Valuation Report for This Property
The Home Valuation Report is an in-depth analysis detailing your home's value as well as a comparison with similar homes in the area
Home Values in the Area
Average Home Value in this Area
Purchase History
| Date | Buyer | Sale Price | Title Company |
|---|---|---|---|
| Cabral 2024 Trust | -- | None Listed On Document | |
| Cabral Michael | -- | Southland Title | |
| -- | $127,000 | -- |
Source: Public Records
Mortgage History
| Date | Status | Borrower | Loan Amount |
|---|---|---|---|
| Previous Owner | Cabral Michael | $270,000 |
Source: Public Records
Tax History Compared to Growth
Tax History
| Year | Tax Paid | Tax Assessment Tax Assessment Total Assessment is a certain percentage of the fair market value that is determined by local assessors to be the total taxable value of land and additions on the property. | Land | Improvement |
|---|---|---|---|---|
| 2025 | $3,912 | $329,129 | $96,625 | $232,504 |
| 2024 | $3,912 | $322,677 | $94,731 | $227,946 |
| 2023 | $3,823 | $316,351 | $92,874 | $223,477 |
| 2022 | $3,720 | $310,149 | $91,053 | $219,096 |
| 2021 | $3,693 | $304,068 | $89,268 | $214,800 |
| 2020 | $3,648 | $300,951 | $88,353 | $212,598 |
| 2019 | $3,582 | $295,051 | $86,621 | $208,430 |
| 2018 | $3,348 | $289,267 | $84,923 | $204,344 |
| 2017 | $3,267 | $283,596 | $83,258 | $200,338 |
| 2016 | $3,212 | $278,036 | $81,626 | $196,410 |
| 2015 | $3,164 | $273,860 | $80,400 | $193,460 |
| 2014 | $3,113 | $268,497 | $78,826 | $189,671 |
Source: Public Records
Map
Nearby Homes
- 4543 Moraga Ave
- 4527 Kickapoo Ct
- 4425 Caminito Pedernal
- 3582 Hatteras Ave
- 3571 Idlewild Way
- 3701 Tavara Cir
- 4731 Norwalk Ave
- 3476 Ogalala Ave
- 3129 Driscoll Dr
- 3112 Luna Ave
- 4135 Huerfano Ave
- 4576 Onondaga Ave
- 4687 Murat Ct
- 4654 Lisann St
- 4150 Taos Dr
- 4690 Lisann St
- 2742 Ariane Dr Unit 153
- 4984 Gaylord Dr
- 4060 Huerfano Ave Unit 146
- 4060 Huerfano Ave Unit 130
- 4533 La Crosse Ave
- 4523 La Crosse Ave
- 4510 Moraga Ave
- 4512 Moraga Ave
- 4517 La Crosse Ave
- 4508 Moraga Ave
- 4516 Moraga Ave
- 4530 La Crosse Ave
- 4524 La Crosse Ave
- 4534 La Crosse Ave
- 4518 La Crosse Ave
- 4511 La Crosse Ave
- 4504 Moraga Ave
- 3387 Hopi Place
- 3379 Hopi Place
- 4512 La Crosse Ave
- 4540 La Crosse Ave
- 3395-97 Hopi Place
- 3395 Hopi Place Unit 97
- 4505 La Crosse Ave