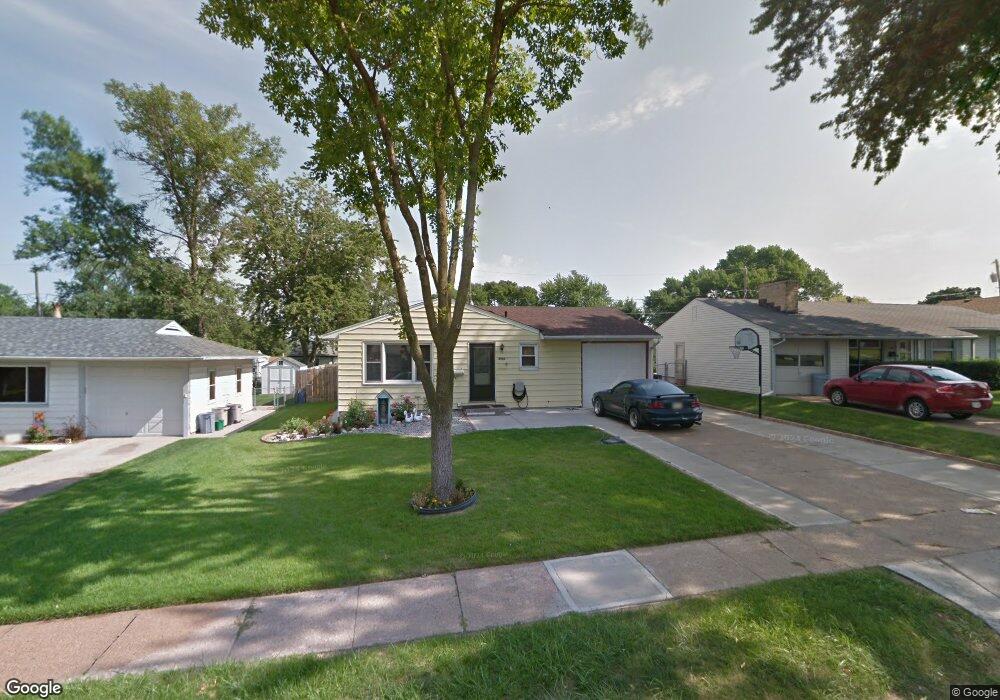
4532 Krug Ave Omaha, NE 68106
Robin Hill NeighborhoodEstimated Value: $185,000 - $234,000
3
Beds
2
Baths
1,359
Sq Ft
$156/Sq Ft
Est. Value
About This Home
This home is located at 4532 Krug Ave, Omaha, NE 68106 and is currently estimated at $212,102, approximately $156 per square foot. 4532 Krug Ave is a home located in Douglas County with nearby schools including Jefferson Elementary School, Norris Middle School, and St Thomas More School.
Ownership History
Date
Name
Owned For
Owner Type
Purchase Details
Closed on
Mar 5, 2013
Sold by
Escobar Luz M and Villacorta Rene
Bought by
Villacorta Karolina G
Current Estimated Value
Home Financials for this Owner
Home Financials are based on the most recent Mortgage that was taken out on this home.
Original Mortgage
$79,532
Outstanding Balance
$55,509
Interest Rate
3.3%
Mortgage Type
FHA
Estimated Equity
$156,593
Purchase Details
Closed on
Mar 4, 2013
Sold by
Villacorta Reynaldo and Villacorta Mirian
Bought by
Villacorta Karolina G
Home Financials for this Owner
Home Financials are based on the most recent Mortgage that was taken out on this home.
Original Mortgage
$79,532
Outstanding Balance
$55,509
Interest Rate
3.3%
Mortgage Type
FHA
Estimated Equity
$156,593
Purchase Details
Closed on
Oct 31, 2008
Sold by
Bank Of New York Tr
Bought by
Escobar Luz M
Create a Home Valuation Report for This Property
The Home Valuation Report is an in-depth analysis detailing your home's value as well as a comparison with similar homes in the area
Home Values in the Area
Average Home Value in this Area
Purchase History
| Date | Buyer | Sale Price | Title Company |
|---|---|---|---|
| Villacorta Karolina G | $81,000 | None Available | |
| Villacorta Karolina G | -- | None Available | |
| Escobar Luz M | $83,900 | -- |
Source: Public Records
Mortgage History
| Date | Status | Borrower | Loan Amount |
|---|---|---|---|
| Open | Villacorta Karolina G | $79,532 |
Source: Public Records
Tax History Compared to Growth
Tax History
| Year | Tax Paid | Tax Assessment Tax Assessment Total Assessment is a certain percentage of the fair market value that is determined by local assessors to be the total taxable value of land and additions on the property. | Land | Improvement |
|---|---|---|---|---|
| 2024 | $3,118 | $182,500 | $14,200 | $168,300 |
| 2023 | $3,118 | $147,800 | $14,200 | $133,600 |
| 2022 | $3,161 | $148,100 | $14,500 | $133,600 |
| 2021 | $2,807 | $132,600 | $14,500 | $118,100 |
| 2020 | $2,349 | $109,700 | $14,500 | $95,200 |
| 2019 | $2,356 | $109,700 | $14,500 | $95,200 |
| 2018 | $2,006 | $93,300 | $14,500 | $78,800 |
| 2017 | $1,847 | $85,500 | $14,200 | $71,300 |
| 2016 | $1,835 | $85,500 | $14,200 | $71,300 |
| 2015 | $1,810 | $85,500 | $14,200 | $71,300 |
| 2014 | $1,810 | $85,500 | $14,200 | $71,300 |
Source: Public Records
Map
Nearby Homes