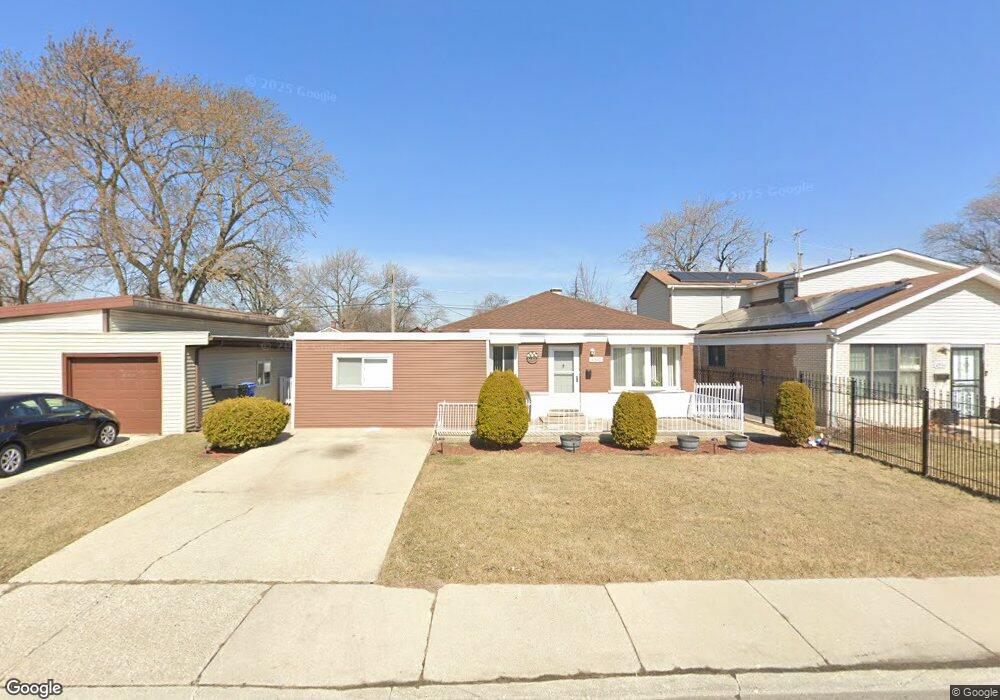
4540 W 84th Place Chicago, IL 60652
Scottsdale NeighborhoodEstimated Value: $207,000 - $288,000
3
Beds
1
Bath
998
Sq Ft
$257/Sq Ft
Est. Value
About This Home
This home is located at 4540 W 84th Place, Chicago, IL 60652 and is currently estimated at $256,503, approximately $257 per square foot. 4540 W 84th Place is a home located in Cook County with nearby schools including Durkin Park Elementary School, Bogan Computer Technical High School, and St Bede-Venerable School.
Ownership History
Date
Name
Owned For
Owner Type
Purchase Details
Closed on
Jul 27, 2007
Sold by
Wells Fargo Bank Na
Bought by
Escobedo Mario and Escobedo Ana
Current Estimated Value
Home Financials for this Owner
Home Financials are based on the most recent Mortgage that was taken out on this home.
Original Mortgage
$149,900
Outstanding Balance
$95,151
Interest Rate
6.71%
Mortgage Type
Unknown
Estimated Equity
$161,352
Purchase Details
Closed on
Feb 16, 2007
Sold by
Rivera Mynor I
Bought by
Wells Fargo Bank Na and Securitized Asset Backed Receivable Llc
Purchase Details
Closed on
May 18, 2004
Sold by
Suburban Bank & Trust Co
Bought by
Rivera Mynor I
Home Financials for this Owner
Home Financials are based on the most recent Mortgage that was taken out on this home.
Original Mortgage
$127,920
Interest Rate
6.5%
Mortgage Type
Unknown
Purchase Details
Closed on
Mar 14, 1994
Sold by
Makri Joseph E
Bought by
Beverly Trust Company
Create a Home Valuation Report for This Property
The Home Valuation Report is an in-depth analysis detailing your home's value as well as a comparison with similar homes in the area
Home Values in the Area
Average Home Value in this Area
Purchase History
| Date | Buyer | Sale Price | Title Company |
|---|---|---|---|
| Escobedo Mario | $150,000 | 1St American Title | |
| Wells Fargo Bank Na | -- | None Available | |
| Rivera Mynor I | $160,000 | Pntn | |
| Beverly Trust Company | -- | -- |
Source: Public Records
Mortgage History
| Date | Status | Borrower | Loan Amount |
|---|---|---|---|
| Open | Escobedo Mario | $149,900 | |
| Previous Owner | Rivera Mynor I | $127,920 | |
| Closed | Rivera Mynor I | $31,980 |
Source: Public Records
Tax History Compared to Growth
Tax History
| Year | Tax Paid | Tax Assessment Tax Assessment Total Assessment is a certain percentage of the fair market value that is determined by local assessors to be the total taxable value of land and additions on the property. | Land | Improvement |
|---|---|---|---|---|
| 2024 | $1,495 | $18,000 | $3,024 | $14,976 |
| 2023 | $1,418 | $13,000 | $3,276 | $9,724 |
| 2022 | $1,418 | $13,000 | $3,276 | $9,724 |
| 2021 | $1,117 | $13,000 | $3,276 | $9,724 |
| 2020 | $1,153 | $12,436 | $3,276 | $9,160 |
| 2019 | $1,150 | $13,974 | $3,276 | $10,698 |
| 2018 | $1,133 | $13,974 | $3,276 | $10,698 |
| 2017 | $1,213 | $12,946 | $3,024 | $9,922 |
| 2016 | $1,625 | $12,946 | $3,024 | $9,922 |
| 2015 | $1,910 | $12,946 | $3,024 | $9,922 |
| 2014 | $1,659 | $11,421 | $2,772 | $8,649 |
| 2013 | $1,615 | $11,421 | $2,772 | $8,649 |
Source: Public Records
Map
Nearby Homes
- 4605 W 84th Place
- 8454 S Kostner Ave
- 8618 S Kolmar Ave
- 4536 W 83rd St
- 8534 S Kilpatrick Ave
- 8554 S Keating Ave
- 4421 W 87th St
- 10810 S Kilpatrick Ave Unit 1NE
- 8132 S Kilbourn Ave
- 8069 S Kolmar Ave
- 8772 S Kolmar Ave
- 4327 W 81st St
- 8053 S Kenton Ave
- 8638 S Keeler Ave
- 8515 S Kedvale Ave
- 4263 W 81st St
- 8755 S Corcoran Rd
- 8100 S Kildare Ave
- 8001 S Kilpatrick Ave
- 8650 Laporte Ave Unit 2B
- 4544 W 84th Place
- 4536 W 84th Place
- 4550 W 84th Place
- 4530 W 84th Place
- 8441 S Scottsdale Ave
- 8437 S Scottsdale Ave
- 8445 S Scottsdale Ave
- 8451 S Scottsdale Ave
- 4524 W 84th Place
- 8433 S Scottsdale Ave
- 4556 W 84th Place
- 4543 W 84th Place
- 4537 W 84th Place
- 4547 W 84th Place
- 4533 W 84th Place
- 4553 W 84th Place
- 4518 W 84th Place
- 4527 W 84th Place
- 8429 S Scottsdale Ave
- 4557 W 84th Place